Join us at FabCon Vienna from September 15-18, 2025
The ultimate Fabric, Power BI, SQL, and AI community-led learning event. Save €200 with code FABCOMM.
Get registered- Power BI forums
- Get Help with Power BI
- Desktop
- Service
- Report Server
- Power Query
- Mobile Apps
- Developer
- DAX Commands and Tips
- Custom Visuals Development Discussion
- Health and Life Sciences
- Power BI Spanish forums
- Translated Spanish Desktop
- Training and Consulting
- Instructor Led Training
- Dashboard in a Day for Women, by Women
- Galleries
- Data Stories Gallery
- Themes Gallery
- Contests Gallery
- Quick Measures Gallery
- Notebook Gallery
- Translytical Task Flow Gallery
- TMDL Gallery
- R Script Showcase
- Webinars and Video Gallery
- Ideas
- Custom Visuals Ideas (read-only)
- Issues
- Issues
- Events
- Upcoming Events
Enhance your career with this limited time 50% discount on Fabric and Power BI exams. Ends September 15. Request your voucher.
- Power BI forums
- Forums
- Get Help with Power BI
- Desktop
- Re: How to create a Daily report?
- Subscribe to RSS Feed
- Mark Topic as New
- Mark Topic as Read
- Float this Topic for Current User
- Bookmark
- Subscribe
- Printer Friendly Page
- Mark as New
- Bookmark
- Subscribe
- Mute
- Subscribe to RSS Feed
- Permalink
- Report Inappropriate Content
How to create a Daily report?
I currently have a few report pages that show the analytics of tickets in the company. In the current business we have tickets coming through every day.
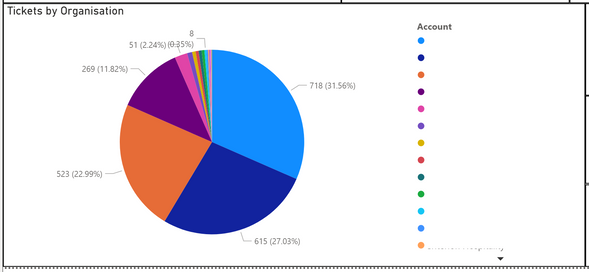
I'm trying to create a page for daily reports so that it only shows tickets coming through on that exact day starting from 12 AM until the next 24 hours. Here is one example I have below (with the organisations deleted for privacy reasons) that shows every ticket in the organisation from each account. Now I want this to show each ticket in the organisation from each account on the current day instead.
Each ticket in the table that I'm using for the report has a Created Time column which indicates when the ticket was created as shown below:
So the main question, is there a measurement that can be added which makes a specific visual only show data on the current day that data was created? Thank you.
Solved! Go to Solution.
- Mark as New
- Bookmark
- Subscribe
- Mute
- Subscribe to RSS Feed
- Permalink
- Report Inappropriate Content
Hi,
in the measure,
ALL ( RequestDetails ) => removes all filters in the table.
please try to replace the above with the below.
ALL ( RequestDetails[CreatedDateTime] ) => removes the filter only in the specific column
Hi, My name is Jihwan Kim.
If this post helps, then please consider accept it as the solution to help other members find it faster, and give a big thumbs up.
Linkedin: https://www.linkedin.com/in/jihwankim1975/
If this post helps, then please consider accepting it as the solution to help other members find it faster, and give a big thumbs up.
Click here to visit my LinkedIn page
Click here to schedule a short Teams meeting to discuss your question.
- Mark as New
- Bookmark
- Subscribe
- Mute
- Subscribe to RSS Feed
- Permalink
- Report Inappropriate Content
Hi, @Anonymous
You can restrict the result of your current measure by adding Calculate function & Filter function with date range to the current measure.
Thank you.
Hi, My name is Jihwan Kim.
If this post helps, then please consider accept it as the solution to help other members find it faster, and give a big thumbs up.
Linkedin: https://www.linkedin.com/in/jihwankim1975/
If this post helps, then please consider accepting it as the solution to help other members find it faster, and give a big thumbs up.
Click here to visit my LinkedIn page
Click here to schedule a short Teams meeting to discuss your question.
- Mark as New
- Bookmark
- Subscribe
- Mute
- Subscribe to RSS Feed
- Permalink
- Report Inappropriate Content
Hello @Jihwan_Kim thank you for the reply.
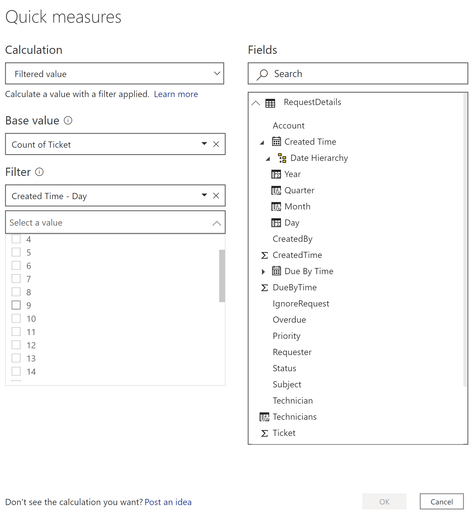
The only issue with the quick measurement is that it requires you to input a specific day of the month, rather than current. For example below:
Sadly I can't find a current day for the measure.
- Mark as New
- Bookmark
- Subscribe
- Mute
- Subscribe to RSS Feed
- Permalink
- Report Inappropriate Content
Hi, @Anonymous
Thank you for your feedback.
Instead of using the Quick Measure Function, how about trying to write by yourself?
I am not quite familiar with using the Quick Measure Function, because I did not try to use it....
You can use TODAY() function when you write the measure by yourself.
Try to write something like below.
Newmeasure =
CALCULATE (
[your measure],
FILTER (
ALL ( DateTABLE ),
[datecolumn]
>= TODAY () - 1
&& [datecolumn] <= TODAY ()
)
)
Or, if it is OK with you, please share your sample pbi file, then I can try to come up with a more accurate measure.
thank you.
Hi, My name is Jihwan Kim.
If this post helps, then please consider accept it as the solution to help other members find it faster, and give a big thumbs up.
Linkedin: https://www.linkedin.com/in/jihwankim1975/
If this post helps, then please consider accepting it as the solution to help other members find it faster, and give a big thumbs up.
Click here to visit my LinkedIn page
Click here to schedule a short Teams meeting to discuss your question.
- Mark as New
- Bookmark
- Subscribe
- Mute
- Subscribe to RSS Feed
- Permalink
- Report Inappropriate Content
Hi, @Jihwan_Kim
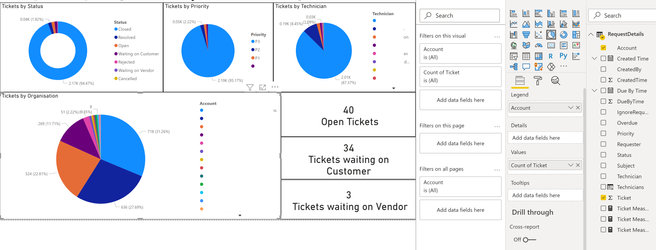
I can't send a template with it being sensitive client data, but thank you for the offer. However, this is the full daily report page I'm constructing with the dataset on the right side:
I tried your new measure, however, there was an issue.
Newmeasure =
CALCULATE (
[your measure],
FILTER (
ALL ( RequestDetails ),
[Created Time]
>= TODAY () - 1
&& [Created Time] <= TODAY ()
)
)
The [your measure] wasn't working as it was trying to detect another measure, but I don't have another measure. (One that's relevant to this that is).
- Mark as New
- Bookmark
- Subscribe
- Mute
- Subscribe to RSS Feed
- Permalink
- Report Inappropriate Content
Hi, @Anonymous
Thank you for your info.
In this case, I think you also need to write the measure for Count Ticket.
I am not sure how you count Tickets, but I assume something like counting the number of rows in the table.
In this case, try to write something like below.
Newmeasure =
CALCULATE (
countrows(RequestDetails),
FILTER (
ALL ( RequestDetails ),
[Created Time]
>= TODAY () - 1
&& [Created Time] <= TODAY ()
)
)
If this post helps, then please consider accepting it as the solution to help other members find it faster, and give a big thumbs up.
Click here to visit my LinkedIn page
Click here to schedule a short Teams meeting to discuss your question.
- Mark as New
- Bookmark
- Subscribe
- Mute
- Subscribe to RSS Feed
- Permalink
- Report Inappropriate Content
Hi, @Jihwan_Kim
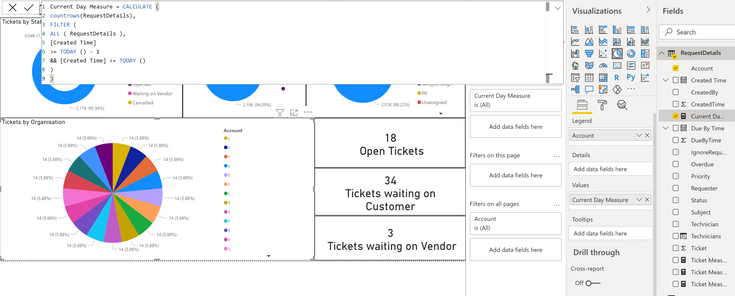
Thanks again for the help, it does count tickets by row you are correct. So if there are 6 rows that are assigned to a specific account, that will be 6 tickets displayed.
Anyway, I put this into practice, however it didn't have the effect I thought it would have and I'm quite baffled with the result. I'm not sure how this happened, it now has 14 tickets for each account displayed?
- Mark as New
- Bookmark
- Subscribe
- Mute
- Subscribe to RSS Feed
- Permalink
- Report Inappropriate Content
Hi,
in the measure,
ALL ( RequestDetails ) => removes all filters in the table.
please try to replace the above with the below.
ALL ( RequestDetails[CreatedDateTime] ) => removes the filter only in the specific column
Hi, My name is Jihwan Kim.
If this post helps, then please consider accept it as the solution to help other members find it faster, and give a big thumbs up.
Linkedin: https://www.linkedin.com/in/jihwankim1975/
If this post helps, then please consider accepting it as the solution to help other members find it faster, and give a big thumbs up.
Click here to visit my LinkedIn page
Click here to schedule a short Teams meeting to discuss your question.
- Mark as New
- Bookmark
- Subscribe
- Mute
- Subscribe to RSS Feed
- Permalink
- Report Inappropriate Content
Thank you very much @Jihwan_Kim I appreciate the help, accepted as best answer.
I was really confused by that last visual representation, but you've solved it 🙂
Helpful resources
| User | Count |
|---|---|
| 71 | |
| 64 | |
| 62 | |
| 50 | |
| 28 |
| User | Count |
|---|---|
| 117 | |
| 75 | |
| 61 | |
| 54 | |
| 42 |


