FabCon is coming to Atlanta
Join us at FabCon Atlanta from March 16 - 20, 2026, for the ultimate Fabric, Power BI, AI and SQL community-led event. Save $200 with code FABCOMM.
Register now!- Power BI forums
- Get Help with Power BI
- Desktop
- Service
- Report Server
- Power Query
- Mobile Apps
- Developer
- DAX Commands and Tips
- Custom Visuals Development Discussion
- Health and Life Sciences
- Power BI Spanish forums
- Translated Spanish Desktop
- Training and Consulting
- Instructor Led Training
- Dashboard in a Day for Women, by Women
- Galleries
- Data Stories Gallery
- Themes Gallery
- Contests Gallery
- Quick Measures Gallery
- Notebook Gallery
- Translytical Task Flow Gallery
- TMDL Gallery
- R Script Showcase
- Webinars and Video Gallery
- Ideas
- Custom Visuals Ideas (read-only)
- Issues
- Issues
- Events
- Upcoming Events
Join the Fabric FabCon Global Hackathon—running virtually through Nov 3. Open to all skill levels. $10,000 in prizes! Register now.
- Power BI forums
- Forums
- Get Help with Power BI
- Desktop
- Re: How to create Rolling Average with +/-St. Dev....
- Subscribe to RSS Feed
- Mark Topic as New
- Mark Topic as Read
- Float this Topic for Current User
- Bookmark
- Subscribe
- Printer Friendly Page
- Mark as New
- Bookmark
- Subscribe
- Mute
- Subscribe to RSS Feed
- Permalink
- Report Inappropriate Content
How to create Rolling Average with +/-St. Dev. Band
Hi,
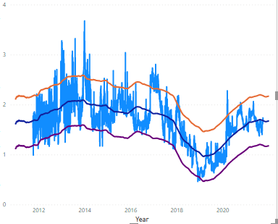
I have a time series column (e.g. date with stock index price). I want to show this stock index as line chart, with 365-day moving average, and +/- 1 std. dev. I created 3 measures on this index: the moving average (MA); the MA+1 std. dev; and MA-1 std. dev. So the chart should like this:
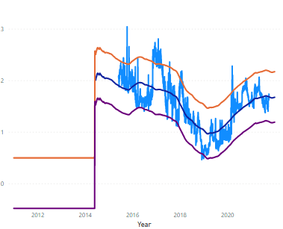
Besides, I want the date-axis respond to a date slicer. But when I change the dates slicer, the chart becomes the following. The date-axis didn't respond, only the stock index partially disappeared, and the 3 measures also behaving wierdly.
(P.S. the measure's value for each day shouldn't change when the date slicer changes)
So, how do I modify my formula to make this work? Here's the formula for the MA+1 std. dev. measure.
Many thanks! Much appreciate you help!
StockIndex_1YMA+sd =
VAR __LAST_DATE = LASTDATE('Data'[Dates].[Date])
RETURN
	AVERAGEX(
		DATESBETWEEN(
			'Data'[Dates].[Date],
			DATEADD(__LAST_DATE, -365, DAY),
			DATEADD(__LAST_DATE, 365, DAY)
			),
		CALCULATE(AVERAGE('Data'[StockIndex]))
       )
    + CALCULATE(STDEVX.S('Data','Data'[StockIndex]),ALL())
Solved! Go to Solution.
- Mark as New
- Bookmark
- Subscribe
- Mute
- Subscribe to RSS Feed
- Permalink
- Report Inappropriate Content
Hi @wlf0032
Do you want to keep the visual in red box and show others in blank?
I think you can add a If function in your measure.
New =
If (Date[Dates]>= MIN(Date[Dates])&&Date[Dates]<=MAX(Date[Dates]),[StockIndex_1YMA+sd],blank())
Or you can try to create an unrelated date table to build the slicer. Then create New measure based on unrelated date table.
Best Regards,
Rico Zhou
If this post helps, then please consider Accept it as the solution to help the other members find it more quickly.
- Mark as New
- Bookmark
- Subscribe
- Mute
- Subscribe to RSS Feed
- Permalink
- Report Inappropriate Content
thanks! IF functions works! but i did it the following way (1Y MA is blank when dates are not selected):
- Mark as New
- Bookmark
- Subscribe
- Mute
- Subscribe to RSS Feed
- Permalink
- Report Inappropriate Content
@wlf0032
I created a Power BI file using MSFT close value, please check if this fits your requirements. I didn't quite understand +1 and -1 here.
MA 365 =
CALCULATE(
    AVERAGE(MSFT[Close]),
    DATESINPERIOD( Dates[Date] , MAX(Dates[Date]) , -365 , DAY )
)
Std + 1 =
[MA 365] +
STDEVX.S(
    DATESINPERIOD( Dates[Date] , MAX(Dates[Date]) , -365 , DAY ),
    [Close Value]
)
Std - 1 =
[MA 365] -
STDEVX.S(
DATESINPERIOD( Dates[Date] , MAX(Dates[Date]) , -365 , DAY ),
[Close Value]
) Check the attachment below my signature
⭕ Subscribe and learn Power BI from these videos
⚪ Website ⚪ LinkedIn ⚪ PBI User Group
- Mark as New
- Bookmark
- Subscribe
- Mute
- Subscribe to RSS Feed
- Permalink
- Report Inappropriate Content
Really appreciate your solution! I tried your way, but this seems doesn't solve my problem.
1. the std dev measure shouldn't be a moving measure. It should be static, i.e. std dev of all available data.
2. this won't help with the date slicer issue. when I filter the date slicer, this std dev still shows on the chart for those dates being filtered out.
Thanks anyway!
- Mark as New
- Bookmark
- Subscribe
- Mute
- Subscribe to RSS Feed
- Permalink
- Report Inappropriate Content
@wlf0032
Got it, you can calculate the STDEV as follows. I did not understand what you meant by "and +/- 1 std. dev. "
Std + 1 = [MA 365] + STDEVX.S( ALL( Dates[Date] ) ,  [Close Value] )


Std - 1  = [MA 365] + STDEVX.S( ALL( Dates[Date] ) ,  [Close Value] )
⭕ Subscribe and learn Power BI from these videos
⚪ Website ⚪ LinkedIn ⚪ PBI User Group


