FabCon is coming to Atlanta
Join us at FabCon Atlanta from March 16 - 20, 2026, for the ultimate Fabric, Power BI, AI and SQL community-led event. Save $200 with code FABCOMM.
Register now!- Power BI forums
- Get Help with Power BI
- Desktop
- Service
- Report Server
- Power Query
- Mobile Apps
- Developer
- DAX Commands and Tips
- Custom Visuals Development Discussion
- Health and Life Sciences
- Power BI Spanish forums
- Translated Spanish Desktop
- Training and Consulting
- Instructor Led Training
- Dashboard in a Day for Women, by Women
- Galleries
- Data Stories Gallery
- Themes Gallery
- Contests Gallery
- QuickViz Gallery
- Quick Measures Gallery
- Visual Calculations Gallery
- Notebook Gallery
- Translytical Task Flow Gallery
- TMDL Gallery
- R Script Showcase
- Webinars and Video Gallery
- Ideas
- Custom Visuals Ideas (read-only)
- Issues
- Issues
- Events
- Upcoming Events
The Power BI Data Visualization World Championships is back! It's time to submit your entry. Live now!
- Power BI forums
- Forums
- Get Help with Power BI
- Desktop
- Re: How to count across rows in a matrix visual
- Subscribe to RSS Feed
- Mark Topic as New
- Mark Topic as Read
- Float this Topic for Current User
- Bookmark
- Subscribe
- Printer Friendly Page
- Mark as New
- Bookmark
- Subscribe
- Mute
- Subscribe to RSS Feed
- Permalink
- Report Inappropriate Content
How to count across rows in a matrix visual
Hi Team
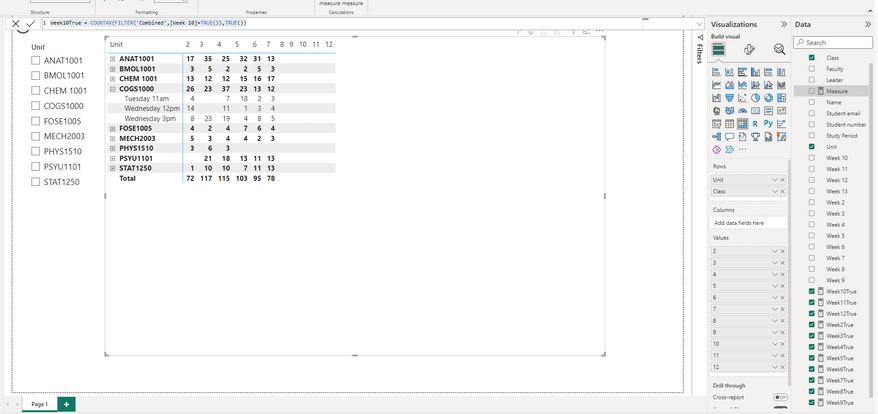
I am compiling a fairly decent set of data where I have data across 11 columns that contain true/false. It's an attendance list and I only care about those who attended. I've created a measure for each week to count the number of trues. I have then put this in a filter by unit and class. This is all great but I would love to get a total on the right side that shows the total the number of attendances each unit. EG for ANAT1001 I would like to see 153.
I've looked for solutions but most of them require going back to the actual data table but as my measures are in there I don't know how to create a column that counts the measures.
Any help greatly appricated
Chloe
Solved! Go to Solution.
- Mark as New
- Bookmark
- Subscribe
- Mute
- Subscribe to RSS Feed
- Permalink
- Report Inappropriate Content
Can you unpivot the source table so that each week isn't a separate column but rather a single column with the value indicating the week that it belongs to? This would normalize your dataset and make this kind of modeling easier to work with.
For example take this
and turn it into this
- Mark as New
- Bookmark
- Subscribe
- Mute
- Subscribe to RSS Feed
- Permalink
- Report Inappropriate Content
Hi John,
Thanks so much for that, unpivoting those columns in my dataflow enabled me to get a matrix table that had both row and column totals.
An additional benefit was that instead of having to have 12 separate measures to count each column I only needed one to count the values column.
Thanks again!
Chloe
- Mark as New
- Bookmark
- Subscribe
- Mute
- Subscribe to RSS Feed
- Permalink
- Report Inappropriate Content
Can you unpivot the source table so that each week isn't a separate column but rather a single column with the value indicating the week that it belongs to? This would normalize your dataset and make this kind of modeling easier to work with.
For example take this
and turn it into this
Helpful resources

Power BI Dataviz World Championships
The Power BI Data Visualization World Championships is back! It's time to submit your entry.

Power BI Monthly Update - January 2026
Check out the January 2026 Power BI update to learn about new features.

| User | Count |
|---|---|
| 66 | |
| 45 | |
| 38 | |
| 26 | |
| 23 |
| User | Count |
|---|---|
| 133 | |
| 120 | |
| 58 | |
| 37 | |
| 31 |


