FabCon is coming to Atlanta
Join us at FabCon Atlanta from March 16 - 20, 2026, for the ultimate Fabric, Power BI, AI and SQL community-led event. Save $200 with code FABCOMM.
Register now!- Power BI forums
- Get Help with Power BI
- Desktop
- Service
- Report Server
- Power Query
- Mobile Apps
- Developer
- DAX Commands and Tips
- Custom Visuals Development Discussion
- Health and Life Sciences
- Power BI Spanish forums
- Translated Spanish Desktop
- Training and Consulting
- Instructor Led Training
- Dashboard in a Day for Women, by Women
- Galleries
- Data Stories Gallery
- Themes Gallery
- Contests Gallery
- QuickViz Gallery
- Quick Measures Gallery
- Visual Calculations Gallery
- Notebook Gallery
- Translytical Task Flow Gallery
- TMDL Gallery
- R Script Showcase
- Webinars and Video Gallery
- Ideas
- Custom Visuals Ideas (read-only)
- Issues
- Issues
- Events
- Upcoming Events
Get Fabric Certified for FREE during Fabric Data Days. Don't miss your chance! Request now
- Power BI forums
- Forums
- Get Help with Power BI
- Desktop
- Re: How to calculate TY vs LY variance
- Subscribe to RSS Feed
- Mark Topic as New
- Mark Topic as Read
- Float this Topic for Current User
- Bookmark
- Subscribe
- Printer Friendly Page
- Mark as New
- Bookmark
- Subscribe
- Mute
- Subscribe to RSS Feed
- Permalink
- Report Inappropriate Content
How to calculate TY vs LY variance
Hi everyone,
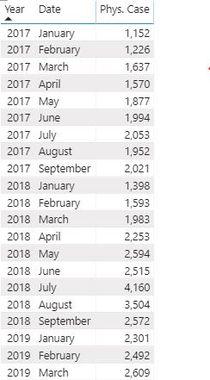
I am using three columns of data:
- Year [2017,2018,2019]
- Date [Jan,Feb,March...etc]
- Phys. Cases [aka "Total Sales"]
I am looking for a New Measure formula to help me find the variance in 'Phys Cases' 2018 vs 2019 and by month.
Any ideas? Thank you for your help.
Solved! Go to Solution.
- Mark as New
- Bookmark
- Subscribe
- Mute
- Subscribe to RSS Feed
- Permalink
- Report Inappropriate Content
First create a new table calendar (if not already done one).
Then try this for the actual number difference:
- Mark as New
- Bookmark
- Subscribe
- Mute
- Subscribe to RSS Feed
- Permalink
- Report Inappropriate Content
I have seen on many boards that creating a new table calendar is the suggested route to take, however with limited Power BI knowledge, I had trouble creating a new table calendar in time to meet my deadline. I was able to create the following workaround:
(1) Create three new meaures to filter Physical Cases by Year:
- New Measure 2: 2018 = CALCULATE(SUM('Table'[Phys. Case]),FILTER('Table','Table'[Year]=2018))
- New Measure 3: 2019 = CALCULATE(SUM('Table'[Phys. Case]),FILTER('Table','Table'[Year]=2019))
(2) Find Physical Case Variance between each year
- '18 vs '19 +/-VAR = 'Table'[2019]-'Table'[2018]
- '18 vs '19 %VAR = IFERROR('Table'[2019]/'Table'[2018]-1,"N/A")
- Mark as New
- Bookmark
- Subscribe
- Mute
- Subscribe to RSS Feed
- Permalink
- Report Inappropriate Content
First create a new table calendar (if not already done one).
Then try this for the actual number difference:
Helpful resources

Power BI Monthly Update - November 2025
Check out the November 2025 Power BI update to learn about new features.

Fabric Data Days
Advance your Data & AI career with 50 days of live learning, contests, hands-on challenges, study groups & certifications and more!


