Hi, my data look like this:
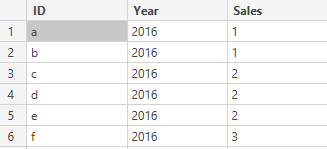
Where each ID can have one sales total for each year.
When visualising this I would want to highlight based off ID alone, instead of ID and Year such that when I select a group based on their sales in one year I would be able to see a highlight based on their sales every year.
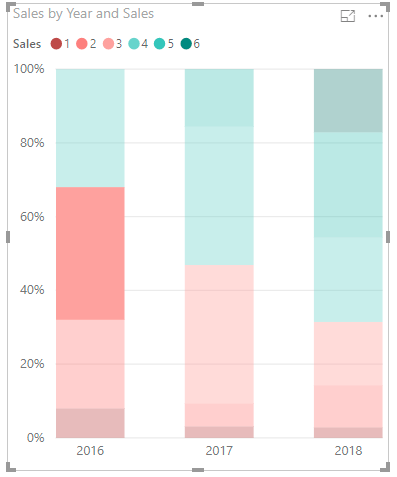
In other words, when selecting sales count 3 in 2016 I want to see highlight of how these ID's performed in 2017 and 2018.
The solution I have found is to create a new table and chart for each year and link the tables based on ID. However my data comes in different time peroids and is regularly updated. I would not want to have to reconfigure the number of charts/filters each time this happens.
Ideally all data will be kept in 1 table and presented in 1 chart.
Thanks.


