Get certified for free when you join Fabric Data Days 2026 and dive into Fabric, Power BI, SQL, AI, and other essential data skills.
Join nowJuly 7 - July 17 | Round 2 of the Power BI Dataviz World Championships. Don't miss your chance! Learn more
Hi, I have this table, I want to grab the Monthly value of ID 1 :
And put it in a calculated column for every ID (taking into account the Month) like this:
How can I achieve this with DAX ?
Thanks
Solved! Go to Solution.
Hi @Anonymous
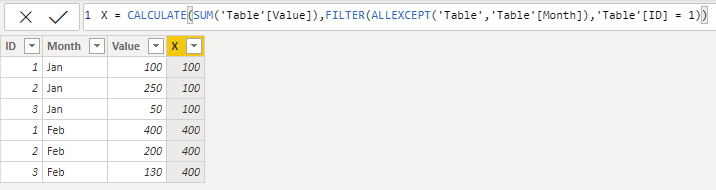
what about this solution:
X = CALCULATE(SUM('Table'[Value]),FILTER(ALLEXCEPT('Table','Table'[Month]),'Table'[ID] = 1))
With kind regards from the town where the legend of the 'Pied Piper of Hamelin' is at home
FrankAT (Proud to be a Datanaut)
Hi,
This calculated column formula works
=CALCULATE(SUM(Data[Value]),FILTER(Data,Data[ID]=1&&Data[Month]=EARLIER(Data[Month])))
Hope this helps.
Hi,
This calculated column formula works
=CALCULATE(SUM(Data[Value]),FILTER(Data,Data[ID]=1&&Data[Month]=EARLIER(Data[Month])))
Hope this helps.
Hi @Anonymous
what about this solution:
X = CALCULATE(SUM('Table'[Value]),FILTER(ALLEXCEPT('Table','Table'[Month]),'Table'[ID] = 1))
With kind regards from the town where the legend of the 'Pied Piper of Hamelin' is at home
FrankAT (Proud to be a Datanaut)
Hi @Anonymous
I know there's a faster way to do this but I do not know how, but this is how I would approach your problem.
As mentioned, there has to be a quicker way to do it, but this is how I would do it if I couldn't find the quick way.
Join us in Barcelona for FabCon and SQLCon, the Fabric, Power BI, SQL, and AI community event. Save €200 with code FABCMTY200.
Join Data Days 2026: 60 days of free live/on-demand sessions, challenges, study groups, and certification opportunities.
| User | Count |
|---|---|
| 29 | |
| 27 | |
| 26 | |
| 24 | |
| 16 |
| User | Count |
|---|---|
| 53 | |
| 47 | |
| 39 | |
| 31 | |
| 21 |