cancel
Showing results for 
Search instead for 
Did you mean: 

A new Data Days event is coming soon! This time we’re going bigger than ever. Fabric, Power BI, SQL, AI and more. Don't miss out.

Reply
nmck86
Post Patron
Post Patron

Help with 2 data points with the same data types

Hi All,


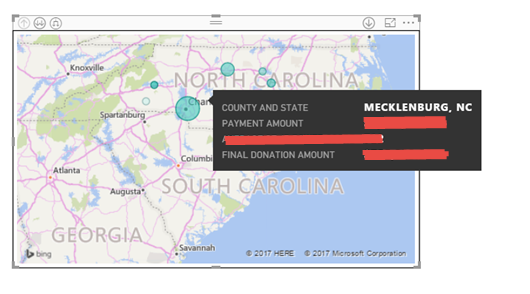
I am building a map view (image attached) and as you can see from the image provided... the $ amounts are coming up seperately. I want the system to recognize that I am pulling information from 2 different sources but want the totals to be a single total as opposed to 2. In this case I have pulled in county information from different sources and the payment information from different sources. I thought a new relationship would work but when I try to create a relationship it doesnt work. Thanks in advance for your assistance.

 2017-03-23_15-46-48.png

1 ACCEPTED SOLUTION
Anonymous
Not applicable

Hi @nmck86,


>> I want the system to recognize that I am pulling information from 2 different sources but want the totals to be a single total as opposed to 2.

Current power bi map visual not support to customize the tooltips, you can vote below idea which has the same requirement:

More customized tooltips for the map feature


>>In this case I have pulled in county information from different sources and the payment information from different sources. 

I'd like to suggest you to use legend field to group the data.(it will show the different percent on the data point)


Regards,

Xiaoxin Sheng

View solution in original post

1 REPLY 1
Anonymous
Not applicable

Hi @nmck86,


>> I want the system to recognize that I am pulling information from 2 different sources but want the totals to be a single total as opposed to 2.

Current power bi map visual not support to customize the tooltips, you can vote below idea which has the same requirement:

More customized tooltips for the map feature


>>In this case I have pulled in county information from different sources and the payment information from different sources. 

I'd like to suggest you to use legend field to group the data.(it will show the different percent on the data point)


Regards,

Xiaoxin Sheng

Helpful resources

Announcements
May Power BI Update Carousel

Power BI Monthly Update - May 2026

Check out the May 2026 Power BI update to learn about new features.

Fabric SQL PBI Data Days

Data Days 2026 coming soon!

Sign up to receive a private message when registration opens and key events begin.

New to Fabric survey Carousel

New to Fabric Survey

If you have recently started exploring Fabric, we'd love to hear how it's going. Your feedback can help with product improvements.

Power BI DataViz World Championships carousel

Power BI DataViz World Championships - June 2026

A new Power BI DataViz World Championship is coming this June! Don't miss out on submitting your entry.