FabCon is coming to Atlanta
Join us at FabCon Atlanta from March 16 - 20, 2026, for the ultimate Fabric, Power BI, AI and SQL community-led event. Save $200 with code FABCOMM.
Register now!- Power BI forums
- Get Help with Power BI
- Desktop
- Service
- Report Server
- Power Query
- Mobile Apps
- Developer
- DAX Commands and Tips
- Custom Visuals Development Discussion
- Health and Life Sciences
- Power BI Spanish forums
- Translated Spanish Desktop
- Training and Consulting
- Instructor Led Training
- Dashboard in a Day for Women, by Women
- Galleries
- Data Stories Gallery
- Themes Gallery
- Contests Gallery
- Quick Measures Gallery
- Notebook Gallery
- Translytical Task Flow Gallery
- TMDL Gallery
- R Script Showcase
- Webinars and Video Gallery
- Ideas
- Custom Visuals Ideas (read-only)
- Issues
- Issues
- Events
- Upcoming Events
To celebrate FabCon Vienna, we are offering 50% off select exams. Ends October 3rd. Request your discount now.
- Power BI forums
- Forums
- Get Help with Power BI
- Desktop
- Re: Have values in a radar chart not be split by d...
- Subscribe to RSS Feed
- Mark Topic as New
- Mark Topic as Read
- Float this Topic for Current User
- Bookmark
- Subscribe
- Printer Friendly Page
- Mark as New
- Bookmark
- Subscribe
- Mute
- Subscribe to RSS Feed
- Permalink
- Report Inappropriate Content
Have values in a radar chart not be split by dimensions in a legend
Hey everyone! Powerbi newbie here. I'm not sure if this is possible but I'll post my question below:
For context, this was an employee experience survey and I want to display information in a radar chart. There are 2 things I want to display:
1. An overall score (Labelled - Importance).
2. The overall score divided by department (back-end, mid-end, front-end).
Here is an image of what I want:
I am able to do this by creating a separate measure of the same value and putting it in the values tab. The issue is that this then results in there being 6 items in the legend (Eg. Importance - front-end/mid-end/back-end, Overall Importance - front-end/mid-end/back-end) where as the result I want is to only have 4 items in the legend (Eg. Value - front-end/mid-end/back-end, Overall Value)
Below is an image of what happens:
Below is an image of what I want:
How might I achieve what I want?
If there is anything that isn't clear/any other info needed let me know. Thanks!
- Mark as New
- Bookmark
- Subscribe
- Mute
- Subscribe to RSS Feed
- Permalink
- Report Inappropriate Content
Hey @Anonymous. Thanks for the help.
My data set does not contain any dates so I don't think the formula with MONTH will work. I've attached images of my data set below.
Fact Table:
Dimension Table:
Does the formula need to be altered to fit this dataset? Thanks for the help.
Best Regards,
Data_Hero
- Mark as New
- Bookmark
- Subscribe
- Mute
- Subscribe to RSS Feed
- Permalink
- Report Inappropriate Content
Hi @Data_Hero ,
I created some data:
Table:
Table2:
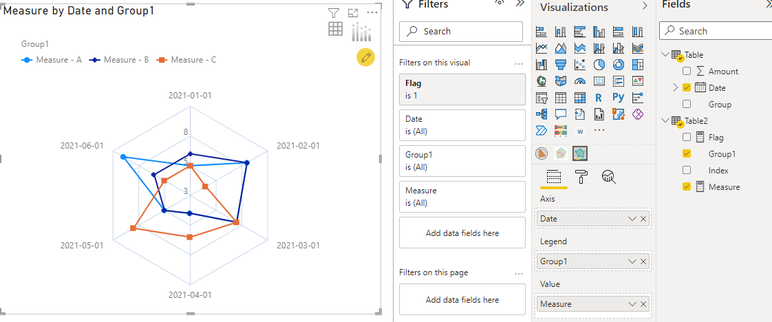
Visual:
Here are the steps you can follow:
1. You can use Enter data to create a table.
2. Create measure.
Measure =
SWITCH(
    TRUE(), MAX('Table2'[Group1])="A",CALCULATE(SUM('Table'[Amount]),FILTER(ALL('Table'),'Table'[Group]="A"&&MONTH('Table'[Date])=MONTH(MAX('Table'[Date]))))  ,
MAX('Table2'[Group1])="B", CALCULATE(SUM('Table'[Amount]),FILTER(ALL('Table'),'Table'[Group]="B"&&MONTH('Table'[Date])=MONTH(MAX('Table'[Date]))))  ,
MAX('Table2'[Group1])="C", CALCULATE(SUM('Table'[Amount]),FILTER(ALL('Table'),'Table'[Group]="C"&&MONTH('Table'[Date])=MONTH(MAX('Table'[Date]))))  ,
MAX('Table2'[Group1])="D", CALCULATE(SUM('Table'[Amount]),FILTER(ALL('Table'),'Table'[Group]="D"&&MONTH('Table'[Date])=MONTH(MAX('Table'[Date])))) ,
MAX('Table2'[Group1])="E", CALCULATE(SUM('Table'[Amount]),FILTER(ALL('Table'),'Table'[Group]="E"&&MONTH('Table'[Date])=MONTH(MAX('Table'[Date]))))  )
Flag = IF(
MAX('Table2'[lndex])<=3,1,0)3. Place [Flag]in Filters, set is=1, apply filter.
4. Result:
Best Regards,
Liu Yang
If this post helps, then please consider Accept it as the solution to help the other members find it more quickly


