Hi @drallam,
I have data sets (excel Files) from each week and a new file is generated every week. how do i visualize that data and be dynamic?
As @Phil_Seamark has mentioned above, using Folder connector could be a good choice here in your scenario. For more details about how to import data from a folder in Power BI Desktop, you can refer to this article. 
Excatly. I;m trying to assign the dates in another column. you replied to that post too.
Based on my test, you should be able to follow steps below to get your expected result.
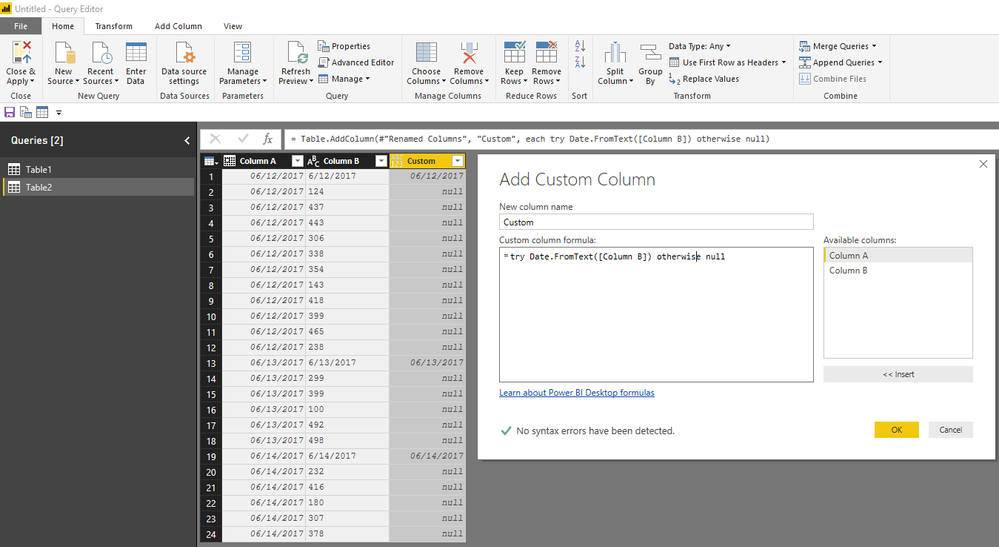
1. Use the formula below to add a custom column under Add Column tab in Query Editor.
=try Date.FromText([Column B]) otherwise null
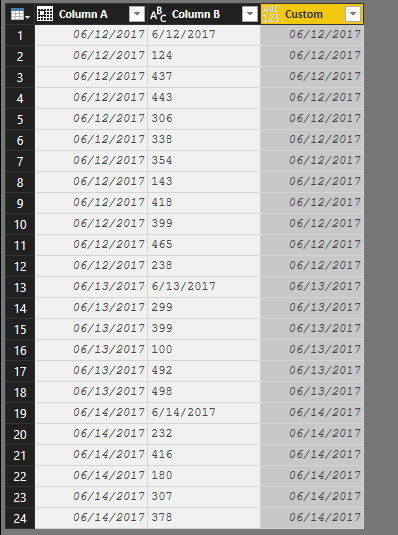
2. Use the Fill Down option to fill the null value with the corresponding date in the column.

Regards


