Huge last-minute discounts for FabCon Vienna from September 15-18, 2025
Supplies are limited. Contact info@espc.tech right away to save your spot before the conference sells out.
Get your discount- Power BI forums
- Get Help with Power BI
- Desktop
- Service
- Report Server
- Power Query
- Mobile Apps
- Developer
- DAX Commands and Tips
- Custom Visuals Development Discussion
- Health and Life Sciences
- Power BI Spanish forums
- Translated Spanish Desktop
- Training and Consulting
- Instructor Led Training
- Dashboard in a Day for Women, by Women
- Galleries
- Data Stories Gallery
- Themes Gallery
- Contests Gallery
- Quick Measures Gallery
- Notebook Gallery
- Translytical Task Flow Gallery
- TMDL Gallery
- R Script Showcase
- Webinars and Video Gallery
- Ideas
- Custom Visuals Ideas (read-only)
- Issues
- Issues
- Events
- Upcoming Events
Score big with last-minute savings on the final tickets to FabCon Vienna. Secure your discount
- Power BI forums
- Forums
- Get Help with Power BI
- Desktop
- Re: Grouping measures in a matrix
- Subscribe to RSS Feed
- Mark Topic as New
- Mark Topic as Read
- Float this Topic for Current User
- Bookmark
- Subscribe
- Printer Friendly Page
- Mark as New
- Bookmark
- Subscribe
- Mute
- Subscribe to RSS Feed
- Permalink
- Report Inappropriate Content
Grouping measures in a matrix
Hi, Guys.
I have 4 measures (ROI, EBITDA, KPI 1, KPI 2) and I would like to classify in groups:
FINANCE: ROI, EBITDA
SALES: KPI 1, KPI 2
And I woud like to get this matrix:
I appreciate any solutions.
Thanks in advance.
Solved! Go to Solution.
- Mark as New
- Bookmark
- Subscribe
- Mute
- Subscribe to RSS Feed
- Permalink
- Report Inappropriate Content
You can format each in the new measure. Please check the file again.
Did I answer your question? Mark my post as a solution!
https://allure-analytics.com/
https://www.youtube.com/channel/UCndD_QZVNB_JWYLEmP6KrpA
https://www.linkedin.com/company/77757292/
Proud to be a Super User!
- Mark as New
- Bookmark
- Subscribe
- Mute
- Subscribe to RSS Feed
- Permalink
- Report Inappropriate Content
Hi @Andres_Maldo ,
I created some data:
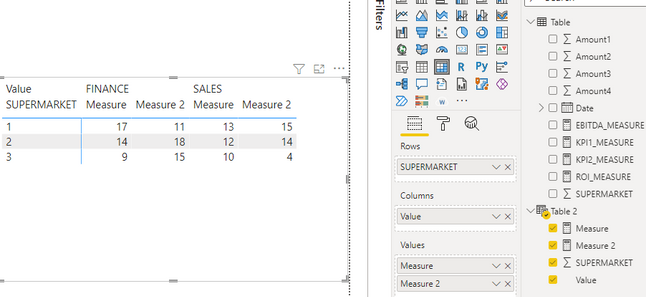
Here are the steps you can follow:
1. Create caluculated table.
Table 2 =
CROSSJOIN(
    VALUES('Table'[SUPERMARKET]),{"FINANCE","SALES"})
2. Create measure.
ROI_MEASURE = CALCULATE(SUM('Table'[Amount1]),FILTER(ALL('Table'),'Table'[SUPERMARKET]=MAX('Table'[SUPERMARKET])))EBITDA_MEASURE = CALCULATE(SUM('Table'[Amount2]),FILTER(ALL('Table'),'Table'[SUPERMARKET]=MAX('Table'[SUPERMARKET])))KPI1_MEASURE = CALCULATE(SUM('Table'[Amount3]),FILTER(ALL('Table'),'Table'[SUPERMARKET]=MAX('Table'[SUPERMARKET])))KPI2_MEASURE = CALCULATE(SUM('Table'[Amount4]),FILTER(ALL('Table'),'Table'[SUPERMARKET]=MAX('Table'[SUPERMARKET])))Measure =
SWITCH(
TRUE(),
MAX('Table 2'[Value])="FINANCE",CALCULATE([ROI_MEASURE],FILTER('Table','Table'[SUPERMARKET]=MAX('Table 2'[SUPERMARKET]))),
MAX('Table 2'[Value])="SALES",CALCULATE([EBITDA_MEASURE],FILTER('Table','Table'[SUPERMARKET]=MAX('Table 2'[SUPERMARKET]))) )Measure 2 =
SWITCH(
TRUE(),
MAX('Table 2'[Value])="FINANCE",CALCULATE([KPI1_MEASURE],FILTER('Table','Table'[SUPERMARKET]=MAX('Table 2'[SUPERMARKET]))),
MAX('Table 2'[Value])="SALES",CALCULATE([KPI2_MEASURE],FILTER('Table','Table'[SUPERMARKET]=MAX('Table 2'[SUPERMARKET]))) )3. Result:
Best Regards,
Liu Yang
If this post helps, then please consider Accept it as the solution to help the other members find it more quickly
- Mark as New
- Bookmark
- Subscribe
- Mute
- Subscribe to RSS Feed
- Permalink
- Report Inappropriate Content
Hi, @Andres_Maldo
You can try this approach if fits to your data structure.
Did I answer your question? Mark my post as a solution!
https://allure-analytics.com/
https://www.youtube.com/channel/UCndD_QZVNB_JWYLEmP6KrpA
https://www.linkedin.com/company/77757292/
Proud to be a Super User!
- Mark as New
- Bookmark
- Subscribe
- Mute
- Subscribe to RSS Feed
- Permalink
- Report Inappropriate Content
Hi, ALLUREAN.
Thanks, but I have measures instead of columns. And I need to be measures. I am wondering is there is a way to group these measure in a matrix.
- Mark as New
- Bookmark
- Subscribe
- Mute
- Subscribe to RSS Feed
- Permalink
- Report Inappropriate Content
I use your 4 measures into one, not columns
Did I answer your question? Mark my post as a solution!
https://allure-analytics.com/
https://www.youtube.com/channel/UCndD_QZVNB_JWYLEmP6KrpA
https://www.linkedin.com/company/77757292/
Proud to be a Super User!
- Mark as New
- Bookmark
- Subscribe
- Mute
- Subscribe to RSS Feed
- Permalink
- Report Inappropriate Content
Thanks, I see. That´s an interesting approach, but what if I want KPI1 as a decimal number, KPI2 as a whole number and ROI as a percentaje? And I want to use conditional formatting in just one measure?
- Mark as New
- Bookmark
- Subscribe
- Mute
- Subscribe to RSS Feed
- Permalink
- Report Inappropriate Content
You can format each in the new measure. Please check the file again.
Did I answer your question? Mark my post as a solution!
https://allure-analytics.com/
https://www.youtube.com/channel/UCndD_QZVNB_JWYLEmP6KrpA
https://www.linkedin.com/company/77757292/
Proud to be a Super User!
- Mark as New
- Bookmark
- Subscribe
- Mute
- Subscribe to RSS Feed
- Permalink
- Report Inappropriate Content
Hi, @ALLUREAN.
I used a similar dax for colors, and it worked for conditional formatting.
- Mark as New
- Bookmark
- Subscribe
- Mute
- Subscribe to RSS Feed
- Permalink
- Report Inappropriate Content
Thanks, and I would like to use different conditional formating for each measure, for example, KP1 is going to be red if it is greater than 30 and green if it is lower than 30. But ROI is going to be green if it is greater than 10% and red if is lower than 10%.


