Forum Discussion

Grouping and Dates Formula

 8 years ago
Hi Anonymous,
I modify the old formula. Please try it again.
Result =
VAR minChangeDate =
    CALCULATE ( MIN ( 'Table'[Date of Change] ), ALL ( 'Table' ) )
VAR maxChangeDate =
    CALCULATE ( MAX ( 'Table'[Date of Change] ), ALL ( 'Table' ) )
RETURN
    DATEDIFF (
        CALCULATE (
            MIN ( 'table'[Old Value Date] ),
            FILTER ( ALL ( 'Table' ), 'Table'[Date of Change] = minChangeDate )
        ),
        CALCULATE (
            MAX ( 'table'[New Del Value Date] ),
            FILTER ( ALL ( 'Table' ), 'Table'[Date of Change] = maxChangeDate )
        ),
        DAY
    )
About grouping:
grouping =
SUMX (
    SUMMARIZE (
        'Table',
        'Table'[Sales Order],
        [Old Value Date],
        [New Del Value Date],
        [Date of Change],
        "Value", [Result]
    ),
    [Value]
)
Best Regards,
Dale
@ v-jiascu-msft
Thank you for replying.
However, the formula returns me the value of 122 days, which is incorrect.
92 days should be the answer.
Besides, can you help me in grouping the SO numbers in table ?
So I can see how many repeated times per SO number. Shown below screenshot. You may provide steps or screenshot.
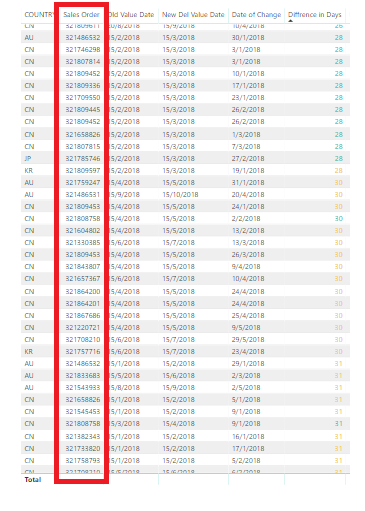
Hi Anonymous,
Can you share the data in TEXT mode or share the file? It's a hard work to type so many words.
1. Can you post a snapshot? It should work in the table visual of the second snapshot of your first post.
2. What the format of table do you expect? Maybe you can try the following formula.
Table =
SUMMARIZE (
    'salestable',
    'salestable'[Sales Order],
    "Times", COUNT ( 'salestable'[Sales Order] )
)
Best Regards,
Dale
- Anonymous8 years agoNot applicable
The file is propietary.
It will take awhile for me to recreate the file.
1)Below is the screenshot please refer.
The actual result should be 92 days instead of 122days
2) As for grouping Sales Order, I am expecting something as of below, darken frame shown below. More with visualization.
If possible to show sum below each sales order group.
- Anonymous8 years agoNot applicable
Let me know if you are getting my replies.
Looking forward to hear a solution from you soon.
- v-jiascu-msft8 years agoMicrosoft Employee
Hi Anonymous,
I modify the old formula. Please try it again.
Result =
VAR minChangeDate =
    CALCULATE ( MIN ( 'Table'[Date of Change] ), ALL ( 'Table' ) )
VAR maxChangeDate =
    CALCULATE ( MAX ( 'Table'[Date of Change] ), ALL ( 'Table' ) )
RETURN
    DATEDIFF (
        CALCULATE (
            MIN ( 'table'[Old Value Date] ),
            FILTER ( ALL ( 'Table' ), 'Table'[Date of Change] = minChangeDate )
        ),
        CALCULATE (
            MAX ( 'table'[New Del Value Date] ),
            FILTER ( ALL ( 'Table' ), 'Table'[Date of Change] = maxChangeDate )
        ),
        DAY
    )
About grouping:
grouping =
SUMX (
    SUMMARIZE (
        'Table',
        'Table'[Sales Order],
        [Old Value Date],
        [New Del Value Date],
        [Date of Change],
        "Value", [Result]
    ),
    [Value]
)
Best Regards,
Dale