FabCon is coming to Atlanta
Join us at FabCon Atlanta from March 16 - 20, 2026, for the ultimate Fabric, Power BI, AI and SQL community-led event. Save $200 with code FABCOMM.
Register now!- Power BI forums
- Get Help with Power BI
- Desktop
- Service
- Report Server
- Power Query
- Mobile Apps
- Developer
- DAX Commands and Tips
- Custom Visuals Development Discussion
- Health and Life Sciences
- Power BI Spanish forums
- Translated Spanish Desktop
- Training and Consulting
- Instructor Led Training
- Dashboard in a Day for Women, by Women
- Galleries
- Data Stories Gallery
- Themes Gallery
- Contests Gallery
- QuickViz Gallery
- Quick Measures Gallery
- Visual Calculations Gallery
- Notebook Gallery
- Translytical Task Flow Gallery
- TMDL Gallery
- R Script Showcase
- Webinars and Video Gallery
- Ideas
- Custom Visuals Ideas (read-only)
- Issues
- Issues
- Events
- Upcoming Events
The Power BI Data Visualization World Championships is back! Get ahead of the game and start preparing now! Learn more
- Power BI forums
- Forums
- Get Help with Power BI
- Desktop
- Re: Group BY function Calculation
- Subscribe to RSS Feed
- Mark Topic as New
- Mark Topic as Read
- Float this Topic for Current User
- Bookmark
- Subscribe
- Printer Friendly Page
- Mark as New
- Bookmark
- Subscribe
- Mute
- Subscribe to RSS Feed
- Permalink
- Report Inappropriate Content
Group BY function Calculation
Hello,
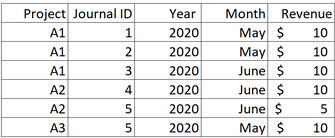
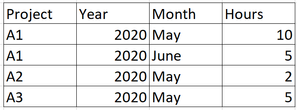
I have two tables: Revenue and Hours. Both these tables have project ID.
Revenue Table:
Work Hours:
I have joined both the tables via Project, Month, and Year. The join was Many to Many.
How should I proceed to get total revenue by project, year, and month divided by total hours by project, year, and month? (As Measure if that's easier or a new column in a third table)
Example efficiency for A1for the month of May is =20/10.
I tried "group by" function in edit query of power BI but that function deletes the Journal ID column. I would like to keep all the columns if possible.
- Mark as New
- Bookmark
- Subscribe
- Mute
- Subscribe to RSS Feed
- Permalink
- Report Inappropriate Content
Hi @Anonymous
If you've fixed the issue on your own please kindly share your solution. if the above posts help, please kindly mark it as a solution to help others find it more quickly. If not, please kindly elaborate more. thanks!
If this post helps, then please consider Accept it as the solution to help the other members find it more
quickly.
- Mark as New
- Bookmark
- Subscribe
- Mute
- Subscribe to RSS Feed
- Permalink
- Report Inappropriate Content
@Anonymous
I think you are going to want to change the structure of your data a bit. You should have a projects table and a date table both of which would link to the hours and revenue table.
once you have that it is pretty straight forward to get the views you are looking for.
I have attached a sample file that shows how to get the date field using the year and month and how to generate a date table.
- Mark as New
- Bookmark
- Subscribe
- Mute
- Subscribe to RSS Feed
- Permalink
- Report Inappropriate Content
@jdbuchanan71 Thank you for the reply, Why do we need a seperate project table?
- Mark as New
- Bookmark
- Subscribe
- Mute
- Subscribe to RSS Feed
- Permalink
- Report Inappropriate Content
You use the project table to view information at the project level. because it sits above both hours and revenue the filters from the project table flow down to both. It's called a start schema and it's how PowerBI is designed to work. You have lookup tables like the Dates table and the Projects table that hold categorical attributes like project name, project description, project owner, project start date, etc. and you have fact tables like hours and revenue. The fact tables typically hold numeric values.
In my sample visual the project column is from the project table, that way the hours and revenue amount from those fact tables work correctly when viewed together at the project level.
- Mark as New
- Bookmark
- Subscribe
- Mute
- Subscribe to RSS Feed
- Permalink
- Report Inappropriate Content
If you want to keep all columns then you cannot use GroupBy.
Write a measure that calculates the ratio. Here is one option
Ratio =
var p=selectedvalue(Revenue[Project])
var y=selectedvalue(Revenue[Year])
var m=selectedvalue(Revenue[Month])
var rev=calculate(sum(Revenue[Revenue]),allselected(Revenue),Revenue[Project]=p,Revenue[Year]=y,Revenue[Month]=m)
var hrs=calculate(sum(Hours[hours]),allselected(Hours),Hours[Project]=p,Hours[Year]=y,Hours[Month]=m)
return divide (rev,hrs)Helpful resources

Power BI Dataviz World Championships
The Power BI Data Visualization World Championships is back! Get ahead of the game and start preparing now!

| User | Count |
|---|---|
| 40 | |
| 36 | |
| 34 | |
| 31 | |
| 27 |
| User | Count |
|---|---|
| 136 | |
| 103 | |
| 67 | |
| 65 | |
| 56 |


