FabCon is coming to Atlanta
Join us at FabCon Atlanta from March 16 - 20, 2026, for the ultimate Fabric, Power BI, AI and SQL community-led event. Save $200 with code FABCOMM.
Register now!- Power BI forums
- Get Help with Power BI
- Desktop
- Service
- Report Server
- Power Query
- Mobile Apps
- Developer
- DAX Commands and Tips
- Custom Visuals Development Discussion
- Health and Life Sciences
- Power BI Spanish forums
- Translated Spanish Desktop
- Training and Consulting
- Instructor Led Training
- Dashboard in a Day for Women, by Women
- Galleries
- Data Stories Gallery
- Themes Gallery
- Contests Gallery
- QuickViz Gallery
- Quick Measures Gallery
- Visual Calculations Gallery
- Notebook Gallery
- Translytical Task Flow Gallery
- TMDL Gallery
- R Script Showcase
- Webinars and Video Gallery
- Ideas
- Custom Visuals Ideas (read-only)
- Issues
- Issues
- Events
- Upcoming Events
Get Fabric Certified for FREE during Fabric Data Days. Don't miss your chance! Request now
- Power BI forums
- Forums
- Get Help with Power BI
- Desktop
- Re: Generate series or table based on measures
- Subscribe to RSS Feed
- Mark Topic as New
- Mark Topic as Read
- Float this Topic for Current User
- Bookmark
- Subscribe
- Printer Friendly Page
- Mark as New
- Bookmark
- Subscribe
- Mute
- Subscribe to RSS Feed
- Permalink
- Report Inappropriate Content
Generate series or table based on measures
Hi!
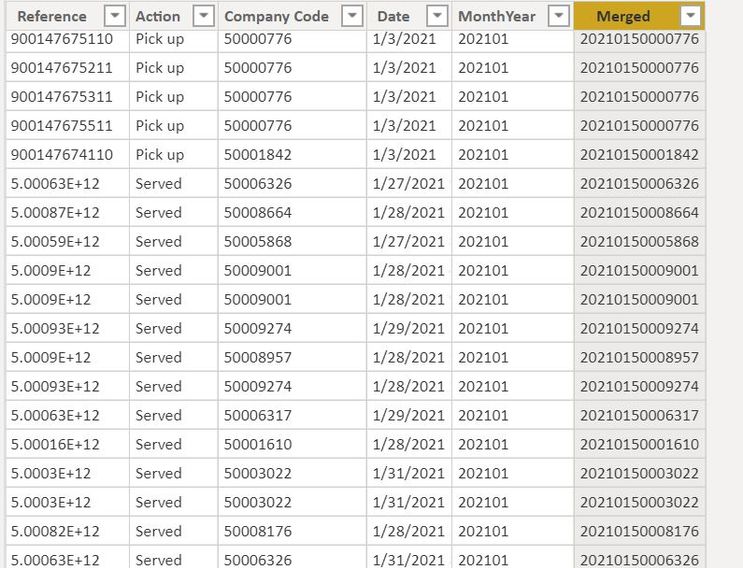
Below is my data for this report (text and photo provided).
| Reference | Action | Company Code | Date | MonthYear | Merged |
| 900147675110 | Pick up | 50000776 | 1/3/2021 | 202101 | 20210150000776 |
| 900147675211 | Pick up | 50000776 | 1/3/2021 | 202101 | 20210150000776 |
| 900147675311 | Pick up | 50000776 | 1/3/2021 | 202101 | 20210150000776 |
| 900147675511 | Pick up | 50000776 | 1/3/2021 | 202101 | 20210150000776 |
| 900147674110 | Pick up | 50001842 | 1/3/2021 | 202101 | 20210150001842 |
| 5.00063E+12 | Served | 50006326 | 1/27/2021 9:58:36 PM | 202101 | 20210150006326 |
| 5.00087E+12 | Served | 50008664 | 1/28/2021 5:09:08 AM | 202101 | 20210150008664 |
| 5.00059E+12 | Served | 50005868 | 1/27/2021 8:07:13 PM | 202101 | 20210150005868 |
| 5.0009E+12 | Served | 50009001 | 1/28/2021 4:24:48 AM | 202101 | 20210150009001 |
| 5.0009E+12 | Served | 50009001 | 1/28/2021 9:47:48 PM | 202101 | 20210150009001 |
| 5.00093E+12 | Served | 50009274 | 1/29/2021 11:44:58 PM | 202101 | 20210150009274 |
| 5.0009E+12 | Served | 50008957 | 1/28/2021 5:09:09 AM | 202101 | 20210150008957 |
| 5.00093E+12 | Served | 50009274 | 1/28/2021 5:09:08 AM | 202101 | 20210150009274 |
| 5.00063E+12 | Served | 50006317 | 1/29/2021 1:14:52 AM | 202101 | 20210150006317 |
| 5.00016E+12 | Served | 50001610 | 1/28/2021 2:30:15 AM | 202101 | 20210150001610 |
| 5.0003E+12 | Served | 50003022 | 1/31/2021 11:44:40 PM | 202101 | 20210150003022 |
| 5.0003E+12 | Served | 50003022 | 1/31/2021 11:24:25 PM | 202101 | 20210150003022 |
and here is my output matrix using the following measures:
Count of Served = CALCULATE(COUNT(SharePoint[Action]),SharePoint[Action]="Served")

Count of PU = CALCULATE(COUNT(SharePoint[Action]),SharePoint[Action]="Pick up")

% of eATW = [Count of Served]/[Count of PU]

Additional Raffle = IF([% of eATW]=1, 4,0)

TotalRaffleTickets = [Count of Served] + [Additional Raffle]
My desired additional table is below (column R in the photo). The generated rows (or series) are based on the total raffle tickets computed. FYI that the 'merged' column is combined columns of MonthYear and the Company Code.
Hope somebody can help me!
- Mark as New
- Bookmark
- Subscribe
- Mute
- Subscribe to RSS Feed
- Permalink
- Report Inappropriate Content
- Mark as New
- Bookmark
- Subscribe
- Mute
- Subscribe to RSS Feed
- Permalink
- Report Inappropriate Content
hi @amitchandak oh, I see. Nevertheless, how to proceed with generating the desired series of measures even though it won't respond to slicer values?
- Mark as New
- Bookmark
- Subscribe
- Mute
- Subscribe to RSS Feed
- Permalink
- Report Inappropriate Content
- Mark as New
- Bookmark
- Subscribe
- Mute
- Subscribe to RSS Feed
- Permalink
- Report Inappropriate Content
Hi, @amitchandak !
Here is the link of sample data in sheet name 'sample'. In the 'pivot' sheet, it displays the desired output I need.
https://drive.google.com/file/d/1f7gV47oqlX-WNKDL_hECUIHNL6kDKM1E/view?usp=sharing
Thank you!
- Mark as New
- Bookmark
- Subscribe
- Mute
- Subscribe to RSS Feed
- Permalink
- Report Inappropriate Content
Hi, @newgirl
I am afraid it is difficult to use dax to expand multiple rows based on the value of a measure column.
If you still have no idea about your problem, you can open a support ticket with MSFT to seek technical support , usually they will have better suggestions.
Best Regards,
Community Support Team _ Eason
Helpful resources

Power BI Monthly Update - November 2025
Check out the November 2025 Power BI update to learn about new features.

Fabric Data Days
Advance your Data & AI career with 50 days of live learning, contests, hands-on challenges, study groups & certifications and more!

| User | Count |
|---|---|
| 104 | |
| 81 | |
| 66 | |
| 50 | |
| 45 |


