This is best Fabric, Power BI, SQL and AI community event. How do we know? The last event sold out! Save €200 with code FABCMTY200.
Register nowA new Data Days event is coming soon! This time we’re going bigger than ever. Fabric, Power BI, SQL, AI and more. Don't miss out.
Hi there
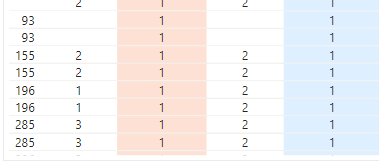
I have created a dashboard which tracks form completion data across 5 different forms (CB, MC, EP, MS, PM, RA). Respondents are located at 7 different sites, and rotate through various medical rotations depending on the date.
What I want to do is display:
I am unsure whether a simple table is the best way to do this. but at the moment I have completed values which repeat across rows, so I think there may be something wrong with my data model.
I have uploaded an anonymised data set and pbix file here.
Thank you in advance for any advice you can provide.
Hi @michb233,
Can you please share dummy data that keep the raw data structure with expected results? They should help us clarify your scenario and test to coding formulas.
How to Get Your Question Answered Quickly
Regards,
Xiaoxin Sheng
Hi there
I have added an "expected results" excel file to the google drive link.
Hopefully that helps.
Many thanks
Michelle
Check out the May 2026 Power BI update to learn about new features.
Sign up to receive a private message when registration opens and key events begin.
If you have recently started exploring Fabric, we'd love to hear how it's going. Your feedback can help with product improvements.
| User | Count |
|---|---|
| 27 | |
| 25 | |
| 25 | |
| 21 | |
| 14 |
| User | Count |
|---|---|
| 50 | |
| 46 | |
| 23 | |
| 18 | |
| 18 |