Get certified for free when you join Fabric Data Days 2026 and dive into Fabric, Power BI, SQL, AI, and other essential data skills.
Join nowJuly 7 - July 17 | Round 2 of the Power BI Dataviz World Championships. Don't miss your chance! Learn more
Hi Team,
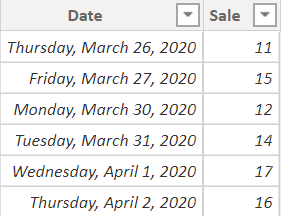
I have the following data
and date table is defined as follows
Solved! Go to Solution.
@Jos13 - Ah, that wasn't really clear from the original email. Well, a few ways of solving that. I suppose the easiest way would be to create a complex selector measure that returned 1 if there were sales in a wee and 0 if not and then just filter on that. https://community.powerbi.com/t5/Quick-Measures-Gallery/The-Complex-Selector/m-p/1116633#M534
@Jos13 - I am not quite following this one. Are you saying that you only want to display the last two weeks of any month in your week slicer?
Hi @Greg_Deckler ,
It is not like that. I want to display those weeks which have sales. In the above example, I have sales for the last two weeks of March. So If I select March, I want week4 & 5. Similarly If I have sales for whole April, I want all the weeks in week slicer when April is selected.
If the current format is followed, sales will be blank when the user selects week 1,2 or 3 for March.
Thanks,
Jos
@Jos13 - Ah, that wasn't really clear from the original email. Well, a few ways of solving that. I suppose the easiest way would be to create a complex selector measure that returned 1 if there were sales in a wee and 0 if not and then just filter on that. https://community.powerbi.com/t5/Quick-Measures-Gallery/The-Complex-Selector/m-p/1116633#M534
Join us in Barcelona for FabCon and SQLCon, the Fabric, Power BI, SQL, and AI community event. Save €200 with code FABCMTY200.
Join Data Days 2026: 60 days of free live/on-demand sessions, challenges, study groups, and certification opportunities.
| User | Count |
|---|---|
| 29 | |
| 26 | |
| 25 | |
| 22 | |
| 18 |
| User | Count |
|---|---|
| 52 | |
| 47 | |
| 43 | |
| 36 | |
| 33 |