FabCon is coming to Atlanta
Join us at FabCon Atlanta from March 16 - 20, 2026, for the ultimate Fabric, Power BI, AI and SQL community-led event. Save $200 with code FABCOMM.
Register now!- Power BI forums
- Get Help with Power BI
- Desktop
- Service
- Report Server
- Power Query
- Mobile Apps
- Developer
- DAX Commands and Tips
- Custom Visuals Development Discussion
- Health and Life Sciences
- Power BI Spanish forums
- Translated Spanish Desktop
- Training and Consulting
- Instructor Led Training
- Dashboard in a Day for Women, by Women
- Galleries
- Data Stories Gallery
- Themes Gallery
- Contests Gallery
- Quick Measures Gallery
- Notebook Gallery
- Translytical Task Flow Gallery
- TMDL Gallery
- R Script Showcase
- Webinars and Video Gallery
- Ideas
- Custom Visuals Ideas (read-only)
- Issues
- Issues
- Events
- Upcoming Events
Calling all Data Engineers! Fabric Data Engineer (Exam DP-700) live sessions are back! Starting October 16th. Sign up.
- Power BI forums
- Forums
- Get Help with Power BI
- Desktop
- Re: Filtering two tables from the same query
- Subscribe to RSS Feed
- Mark Topic as New
- Mark Topic as Read
- Float this Topic for Current User
- Bookmark
- Subscribe
- Printer Friendly Page
- Mark as New
- Bookmark
- Subscribe
- Mute
- Subscribe to RSS Feed
- Permalink
- Report Inappropriate Content
Filtering two tables from the same query
Hi all,
I've created two tables from the same query - one table has data in the original format and the other one (auxiliary, I use it to simplify the calculation of some measures) with the same data but with some columns removed / pivoted. The problem is that the second table doesn't respond to filters that I've set up to control the first (original) dataset. I can't establish relationships between these tables because it is essentially the same data ("columns must have unique values" error) . Is there any way around that or the only way to fix the filtering issue is to change DAX formulas so it doesn't require the second table ?
If what I mean is unclear then I'll show the example of data later
Cheers
Solved! Go to Solution.
- Mark as New
- Bookmark
- Subscribe
- Mute
- Subscribe to RSS Feed
- Permalink
- Report Inappropriate Content
sort of made it work using this solution
http://community.powerbi.com/t5/Desktop/Slicer-and-New-Table-subset-of-original-table/td-p/178616
- Mark as New
- Bookmark
- Subscribe
- Mute
- Subscribe to RSS Feed
- Permalink
- Report Inappropriate Content
Rigosakh,
I recorded a video response for you 🙂
http://www.youtube.com/watch?v=kU_1sreC4R0 (see also attached file)
⚡Power On!⚡
-Avi Singh. Microsoft MVP. PowerBIPro
Power BI Tutorial for Beginners (Step-by-Step) and more on YouTube.com/PowerBIPro
- Mark as New
- Bookmark
- Subscribe
- Mute
- Subscribe to RSS Feed
- Permalink
- Report Inappropriate Content
Hi Avi,
Thank you for the fast reply and an informative video. I can imagine your confusion 🙂 The reason why I'm doing this unusual thing is because I'm terrible at DAX and struggle to create complicated DAX formulae. I'm migrating from doing analysis in Excel and some calculations that relied on extensive use of pivot tables are hard for me to translate into Power BI format. The second (simplified) table was used as a pivot table in excel. I got rid of referencing the query to create a secondary table and now use SUMMARIZECOLUMNS instead. However, the problem remains the same - the filter doesn't control a table created by SUMMARIZECOLUMNS
Please see the snapshot of original data below ("site" ranges between ~1-1000, time between 8am-6pm):
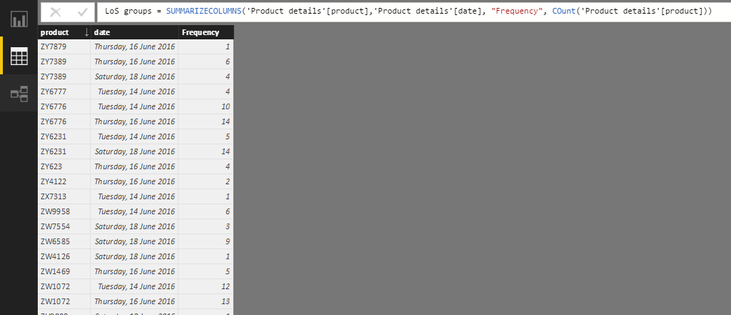
Then using SUMMARIZECOLUMNS I create a new table to count how many times in total each product was registered per day
Then I need to calculate how many 1 values in "frequency" there are, 2 , 3 etc . Then it is also used for another calculation. I'm relatively new to DAX and can't get my head around how to use SUMMARIZECOLUMNS in a measure without creating a new table.
- Mark as New
- Bookmark
- Subscribe
- Mute
- Subscribe to RSS Feed
- Permalink
- Report Inappropriate Content
sort of made it work using this solution
http://community.powerbi.com/t5/Desktop/Slicer-and-New-Table-subset-of-original-table/td-p/178616
- Mark as New
- Bookmark
- Subscribe
- Mute
- Subscribe to RSS Feed
- Permalink
- Report Inappropriate Content
Hi @rigosakh,
You have resolved the original problem via the suggestion in above link you provided, right? If so, would you please accept your sharing solution so that others having similar concern can find the answer more easily?
Regards,
Yuliana Gu
If this post helps, then please consider Accept it as the solution to help the other members find it more quickly.
- Mark as New
- Bookmark
- Subscribe
- Mute
- Subscribe to RSS Feed
- Permalink
- Report Inappropriate Content
Hi @v-yulgu-msft ,
Yes, I've solved the original problem and marked the post with a link as accepted solution. However, this solution caused another issue and I'm not sure whether I should create another topic with a new question or continue posting here ?
Helpful resources

FabCon Global Hackathon
Join the Fabric FabCon Global Hackathon—running virtually through Nov 3. Open to all skill levels. $10,000 in prizes!

Power BI Monthly Update - September 2025
Check out the September 2025 Power BI update to learn about new features.


