Party with Power BI’s own Guy in a Cube
Power BI is turning 10! Tune in for a special live episode on July 24 with behind-the-scenes stories, product evolution highlights, and a sneak peek at what’s in store for the future.
Save the date- Power BI forums
- Get Help with Power BI
- Desktop
- Service
- Report Server
- Power Query
- Mobile Apps
- Developer
- DAX Commands and Tips
- Custom Visuals Development Discussion
- Health and Life Sciences
- Power BI Spanish forums
- Translated Spanish Desktop
- Training and Consulting
- Instructor Led Training
- Dashboard in a Day for Women, by Women
- Galleries
- Data Stories Gallery
- Themes Gallery
- Contests Gallery
- Quick Measures Gallery
- Notebook Gallery
- Translytical Task Flow Gallery
- TMDL Gallery
- R Script Showcase
- Webinars and Video Gallery
- Ideas
- Custom Visuals Ideas (read-only)
- Issues
- Issues
- Events
- Upcoming Events
Enhance your career with this limited time 50% discount on Fabric and Power BI exams. Ends August 31st. Request your voucher.
- Power BI forums
- Forums
- Get Help with Power BI
- Desktop
- Filter for max value based upon another column
- Subscribe to RSS Feed
- Mark Topic as New
- Mark Topic as Read
- Float this Topic for Current User
- Bookmark
- Subscribe
- Printer Friendly Page
- Mark as New
- Bookmark
- Subscribe
- Mute
- Subscribe to RSS Feed
- Permalink
- Report Inappropriate Content
Filter for max value based upon another column
Hi,
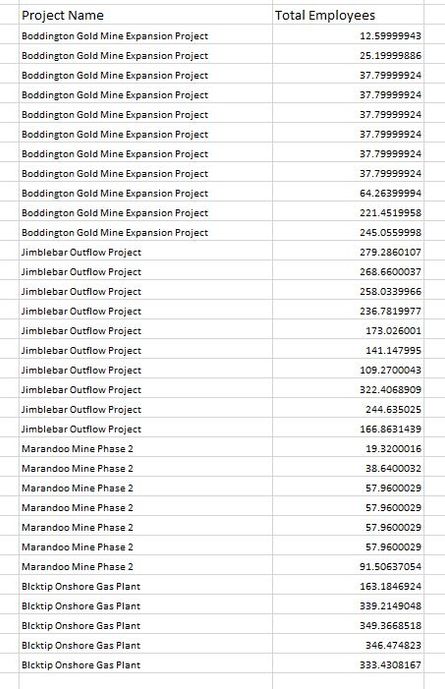
I would like to filter for the max value in one column based upon another column which is a project name over a range of time.
Basically I want to find the max total employees for each project which has multiple entries and create a new table with just the max value for each project
Solved! Go to Solution.
- Mark as New
- Bookmark
- Subscribe
- Mute
- Subscribe to RSS Feed
- Permalink
- Report Inappropriate Content
Hi @Anonymous ,
One sample for your reference. Here we can create a calculated column as below to work on it.
max total = CALCULATE(MAX(Table1[Total Employees]),FILTER(Table1,Table1[Project name]=EARLIER(Table1[Project name])))
If this post helps, then please consider Accept it as the solution to help the others find it more quickly.
- Mark as New
- Bookmark
- Subscribe
- Mute
- Subscribe to RSS Feed
- Permalink
- Report Inappropriate Content
thank you very much
- Mark as New
- Bookmark
- Subscribe
- Mute
- Subscribe to RSS Feed
- Permalink
- Report Inappropriate Content
In Power Query
- select the Project Name column
- Select Group By on the home tab
- Name the column - "Max of Employee Count" for example.
- Select MAX for the operation
- Select the Total Employees column.
The load that into the data model.
Did I answer your question? Mark my post as a solution!
Did my answers help arrive at a solution? Give it a kudos by clicking the Thumbs Up!
DAX is for Analysis. Power Query is for Data Modeling
Proud to be a Super User!
MCSA: BI ReportingHelpful resources

Power BI Monthly Update - July 2025
Check out the July 2025 Power BI update to learn about new features.

| User | Count |
|---|---|
| 72 | |
| 71 | |
| 38 | |
| 29 | |
| 28 |
| User | Count |
|---|---|
| 99 | |
| 88 | |
| 62 | |
| 42 | |
| 39 |


