This is best Fabric, Power BI, SQL and AI community event. How do we know? The last event sold out! Save €200 with code FABCMTY200.
Register nowA new Data Days event is coming soon! This time we’re going bigger than ever. Fabric, Power BI, SQL, AI and more. Don't miss out.
Hi everyone,
I will be more objetive as possible, before create this message, I saw many Messages from other persons, but I've never found something like this.
Someone of my team, asked me to sort downward the values in the Filter Pane, this is different from sort the filters.
Regards,
Hugo Jesus
Solved! Go to Solution.
Hi @HugoJesus ,
Create 3 calculated columns as below:
Year = YEAR('Table'[Date])Rank = RANKX(SUMMARIZE('Table','Table'[Year]),'Table'[Year],,DESC)_Year = 'Table'[Year]
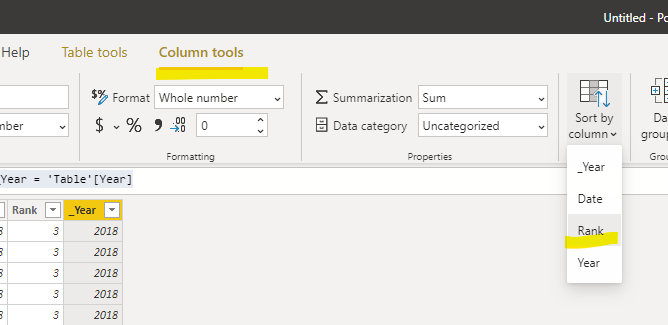
Finally select column _year,go to menu bar>column tools>sort by:rank :
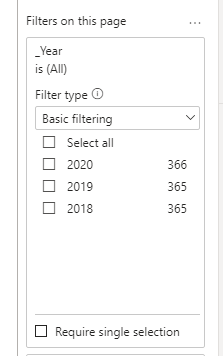
Then put the new column _Year in the filter pane and you will see:
For the related .pbix file,pls click here.
@HugoJesus , you can create desc rank on year and mark that a sort column. then it will sort desc.
Year Rank = RANKX(ALL('Date'),'Date'[Year],,DESC,Dense)
https://docs.microsoft.com/en-us/power-bi/desktop-sort-by-column
Refer this file for the example of the month year desc sort on matrix column
https://www.dropbox.com/s/94zxohjgoaan28e/DescMonthSort.pbix?dl=0
Wonderful solution, thanks a lot Super User IV !
The solution you have presented (
Refer this file for the example of the month year desc sort on matrix column
https://www.dropbox.com/s/94zxohjgoaan28e/DescMonthSort.pbix?dl=0 ) is not working.
Still have the same issue, the dates in the Filter Pane for "Filters on this page" are upward and all i want is to have the values sorted downward.
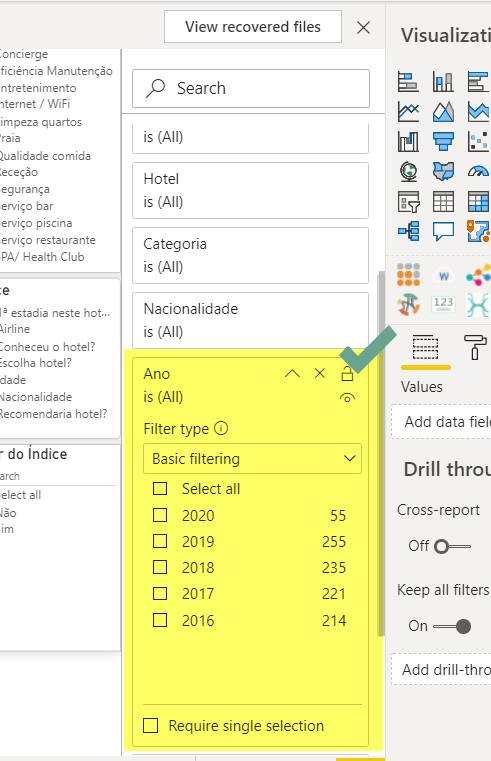
If it's possible, you can send me the PBIX with the same example that i'm sending in the image below
I want to sort Downward the filter tha is highlighted, instead of 2016 - 2020, change for 2020 - 2016, the most recent first.
This is possible to do ?
Hi @HugoJesus ,
Create 3 calculated columns as below:
Year = YEAR('Table'[Date])Rank = RANKX(SUMMARIZE('Table','Table'[Year]),'Table'[Year],,DESC)_Year = 'Table'[Year]
Finally select column _year,go to menu bar>column tools>sort by:rank :
Then put the new column _Year in the filter pane and you will see:
For the related .pbix file,pls click here.
Hi Kelly,
I've did it like you said and "Voilá". Perfect, completely awesome, that's the idea.
I'll repeat to all reports that I've.
Thanks again,
Have a nice week. 🙂
Regards
Hugo Jesus
Below It's my example.
Check out the May 2026 Power BI update to learn about new features.
Sign up to receive a private message when registration opens and key events begin.
If you have recently started exploring Fabric, we'd love to hear how it's going. Your feedback can help with product improvements.
| User | Count |
|---|---|
| 28 | |
| 25 | |
| 25 | |
| 22 | |
| 13 |
| User | Count |
|---|---|
| 59 | |
| 50 | |
| 26 | |
| 20 | |
| 20 |