Find everything you need to get certified on Fabric—skills challenges, live sessions, exam prep, role guidance, and a 50 percent discount on exams.
Get startedEarn a 50% discount on the DP-600 certification exam by completing the Fabric 30 Days to Learn It challenge.
Hello,
I've been trying to reproduce the table of this link, but unfortunately I am not able to create the red/green/yellow bullets and I cant see the Retail Analysis Sample in my power BI version. I'd like to create bullets as below:
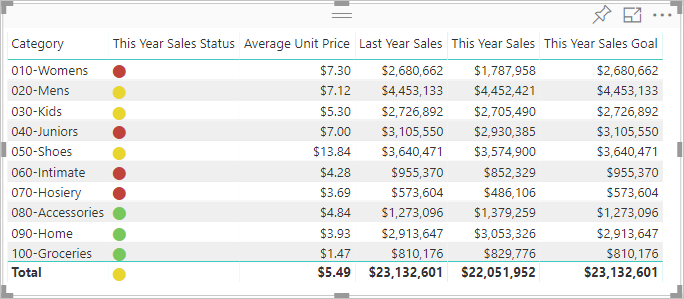
I have seen examples in where people create columns with "URL icons", by creating a new table with a correlation between Column A (numbers) & Column B (icons from URL), but what I need is something like an excel rule in which if table column contains 1 then shows a green icon and if cointains a 0 a red icon.
Can someone help me? Thanks in advance.
Solved! Go to Solution.
HI @jgo1986 ,
You can add a calculated column with unichar function to display symbol icon, then you can enable conditional formatting on it to display different color based on other fields.
Icon = UNICHAR(11044)
Regards,
Xiaoxin Sheng
HI @jgo1986 ,
You can add a calculated column with unichar function to display symbol icon, then you can enable conditional formatting on it to display different color based on other fields.
Icon = UNICHAR(11044)
Regards,
Xiaoxin Sheng
Thanks a Lot,
Worked fine. As I had 3 possible values (0=Black, 1=Green; 2=Red), a lot of KPIs (Rows) and 12 Months(columns), what I did was to convert the text columns to number, then I created another 12 month columns = Unichar (11044) and then I created a Table Visual and applied for each new icon month_column the following steps:
Thanks a lot 🙂