Get certified for free when you join Fabric Data Days 2026 and dive into Fabric, Power BI, SQL, AI, and other essential data skills.
Join nowJuly 7 - July 17 | Round 2 of the Power BI Dataviz World Championships. Don't miss your chance! Learn more
Hi,
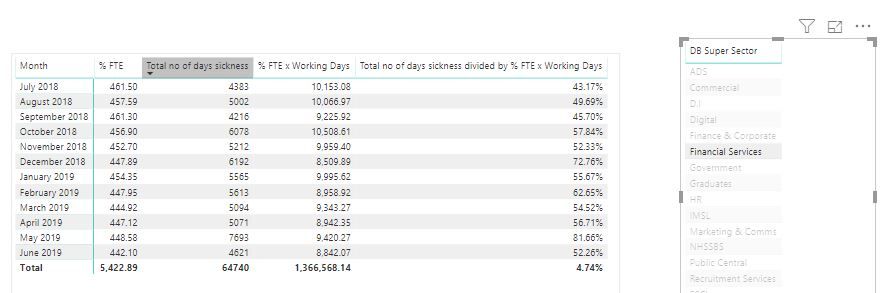
I'm trying to calculate employee sickness absence rate, the end goal is to have a graph showing the absence rate for each month which will change when a different business area is selected. The calulcation will be Total Sickness Days Lost / Available Working Days (Sum of FTE X Working Days for the month)
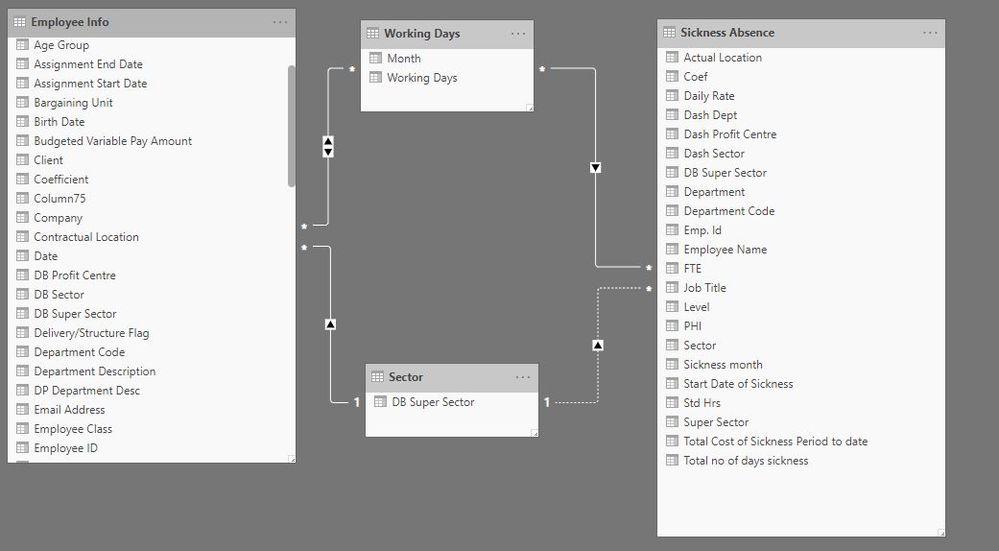
I've started out with 4 tables.
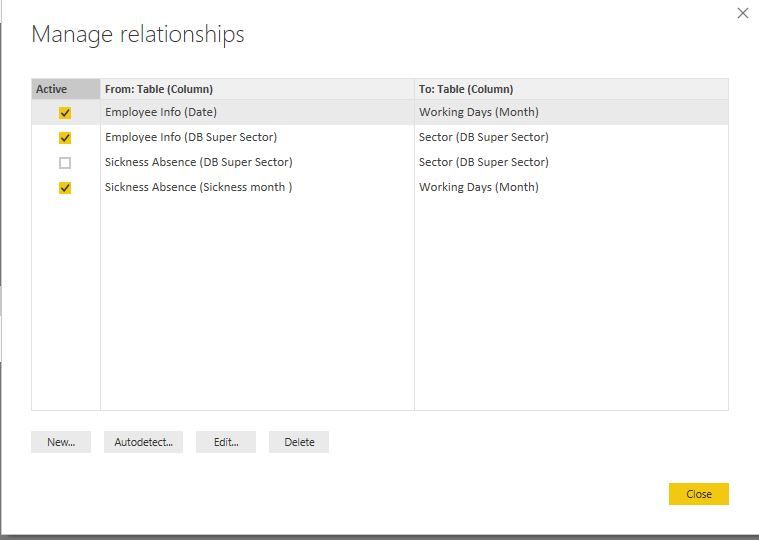
These are the relationships I have set up and I've created a table with what I'm hoping to achieve. When I change the DB Super Sector, it changes the FTE but not the total no of days sickness. I'm sure it's a simple fix but I can't work it out.
A couple of things I noticed:
Proud to be a Super User!
I'm afraid I'm unable to share the file due to the sensitivity of the data.
1. Would that be one directional from Employee Info to Working days?
2. What would I change it to?
3. What type of relationship would this be? Would this then filter all of the other matching columns?
Proud to be a Super User!
okay how do you calculated your measures?
Is it possible for you to share your pbix?
Thanks for the quick reply, the table in the slider is "Sector"
Hi
Which table are you using in the slider? Because you have that column in two tables.
If you are using the Sector table notice that you don't have an active relationship.
Please also provide you DAX measure.
Join us in Barcelona for FabCon and SQLCon, the Fabric, Power BI, SQL, and AI community event. Save €200 with code FABCMTY200.
Join Fabric Data Days 2026: 60 days of free live/on-demand sessions, challenges, study groups, and certification opportunities.
| User | Count |
|---|---|
| 27 | |
| 24 | |
| 18 | |
| 15 | |
| 15 |
| User | Count |
|---|---|
| 63 | |
| 42 | |
| 41 | |
| 39 | |
| 37 |