Party with Power BI’s own Guy in a Cube
Power BI is turning 10! Tune in for a special live episode on July 24 with behind-the-scenes stories, product evolution highlights, and a sneak peek at what’s in store for the future.
Save the date- Power BI forums
- Get Help with Power BI
- Desktop
- Service
- Report Server
- Power Query
- Mobile Apps
- Developer
- DAX Commands and Tips
- Custom Visuals Development Discussion
- Health and Life Sciences
- Power BI Spanish forums
- Translated Spanish Desktop
- Training and Consulting
- Instructor Led Training
- Dashboard in a Day for Women, by Women
- Galleries
- Webinars and Video Gallery
- Data Stories Gallery
- Themes Gallery
- Contests Gallery
- Quick Measures Gallery
- Notebook Gallery
- Translytical Task Flow Gallery
- R Script Showcase
- Ideas
- Custom Visuals Ideas (read-only)
- Issues
- Issues
- Events
- Upcoming Events
Enhance your career with this limited time 50% discount on Fabric and Power BI exams. Ends August 31st. Request your voucher.
- Power BI forums
- Forums
- Get Help with Power BI
- Desktop
- Re: Dynamic date axis on chart showing dates with ...
- Subscribe to RSS Feed
- Mark Topic as New
- Mark Topic as Read
- Float this Topic for Current User
- Bookmark
- Subscribe
- Printer Friendly Page
- Mark as New
- Bookmark
- Subscribe
- Mute
- Subscribe to RSS Feed
- Permalink
- Report Inappropriate Content
Dynamic date axis on chart showing dates with no data
I have researhed and found similar posts but could still not figure out how to get this to work...
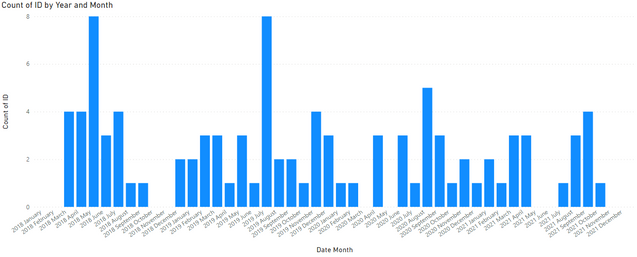
I have a bar chart that shows a distinct count of ID by month. I want the users to be able to select a date range with a slicer and have the chart automatically update to show the data in the selected date range. I also want the months that do not have any records to show on the axis, without a bar, but only those months that are within the selected date range.
This is all of my data:
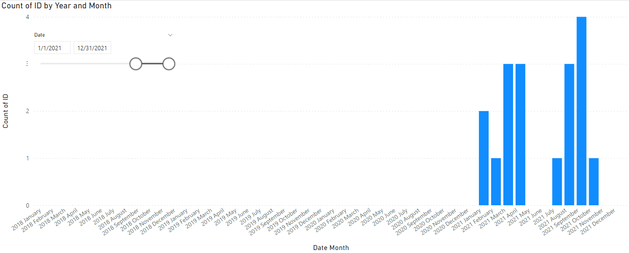
If I select 2021 in a slicer, I either get this if "show items with no data" is checked - all of the months outside of 2021 are showing on the chart with no bar, I do not want to see those months
Or this if I uncheck "show items with no data" - the months that have no records but are withing the selected date range are not showing (i.e. May, June, November and December).
How can I get all of the 2021 months to show, including May, June, November and December?
My pbix file is available here.
Thanks!
Solved! Go to Solution.
- Mark as New
- Bookmark
- Subscribe
- Mute
- Subscribe to RSS Feed
- Permalink
- Report Inappropriate Content
Hi @huguestremblay ,
I do not see the bar chart as your screenshot in your pbix file, please check it.
I have a method you can try.
1 Create a date table for the slicer.
Date for slicer = VALUES('Table'[Date])
2 Create a measure as follows:
Measure =
VAR _count =
    IF( ISBLANK( SUM( 'Table'[Values] ) ), 0, SUM( 'Table'[Values] ) )
VAR _mindate =
    MIN( 'Date for slicer'[Date] )
VAR _maxdate =
    MAX( 'Date for slicer'[Date] )
RETURN
    IF(
        AND(
            DATE( SELECTEDVALUE( 'Table'[Date].[Year] ), SELECTEDVALUE( 'Table'[Date].[MonthNo] ), 1 ) >= _mindate,
            DATE( SELECTEDVALUE( 'Table'[Date].[Year] ), SELECTEDVALUE( 'Table'[Date].[MonthNo] ) + 1, 1 ) - 1 <= _maxdate
        ),
        _count,
        BLANK()
    )
3 Uncheck "show items with no data"
Result:
Pbix in the end you can refer.
Best Regards
Community Support Team _ chenwu zhu
If this post helps, then please consider Accept it as the solution to help the other members find it more quickly.
- Mark as New
- Bookmark
- Subscribe
- Mute
- Subscribe to RSS Feed
- Permalink
- Report Inappropriate Content
Hello,
What I need is a DISTINCTCOUNT (not a SUM) so I have udpated your measure accordingly and it appears to work in my test report. I will transfer to my full report now.
Thank you!
- Mark as New
- Bookmark
- Subscribe
- Mute
- Subscribe to RSS Feed
- Permalink
- Report Inappropriate Content
@huguestremblay there is a great video on this How to return 0 instead of BLANK in DAX - SQLBI
✨ Follow us on LinkedIn and  to our YouTube channel
Learn about conditional formatting at Microsoft Reactor
My latest blog post The Power of Using Calculation Groups with Inactive Relationships (Part 1) (perytus.com) I would ❤ Kudos if my solution helped. 👉 If you can spend time posting the question, you can also make efforts to give Kudos to whoever helped to solve your problem. It is a token of appreciation!
⚡ Visit us at https://perytus.com, your one-stop-shop for Power BI-related projects/training/consultancy.
Subscribe to the @PowerBIHowTo YT channel for an upcoming video on List and Record functions in Power Query!!
Learn Power BI and Fabric - subscribe to our YT channel - Click here: @PowerBIHowTo
If my solution proved useful, I'd be delighted to receive Kudos. When you put effort into asking a question, it's equally thoughtful to acknowledge and give Kudos to the individual who helped you solve the problem. It's a small gesture that shows appreciation and encouragement! ❤
Did I answer your question? Mark my post as a solution. Proud to be a Super User! Appreciate your Kudos 🙂
Feel free to email me with any of your BI needs.
Helpful resources

Power BI Monthly Update - July 2025
Check out the July 2025 Power BI update to learn about new features.

Join our Fabric User Panel
This is your chance to engage directly with the engineering team behind Fabric and Power BI. Share your experiences and shape the future.

| User | Count |
|---|---|
| 64 | |
| 63 | |
| 52 | |
| 39 | |
| 24 |
| User | Count |
|---|---|
| 80 | |
| 57 | |
| 45 | |
| 44 | |
| 35 |


