FabCon is coming to Atlanta
Join us at FabCon Atlanta from March 16 - 20, 2026, for the ultimate Fabric, Power BI, AI and SQL community-led event. Save $200 with code FABCOMM.
Register now!- Power BI forums
- Get Help with Power BI
- Desktop
- Service
- Report Server
- Power Query
- Mobile Apps
- Developer
- DAX Commands and Tips
- Custom Visuals Development Discussion
- Health and Life Sciences
- Power BI Spanish forums
- Translated Spanish Desktop
- Training and Consulting
- Instructor Led Training
- Dashboard in a Day for Women, by Women
- Galleries
- Data Stories Gallery
- Themes Gallery
- Contests Gallery
- QuickViz Gallery
- Quick Measures Gallery
- Visual Calculations Gallery
- Notebook Gallery
- Translytical Task Flow Gallery
- TMDL Gallery
- R Script Showcase
- Webinars and Video Gallery
- Ideas
- Custom Visuals Ideas (read-only)
- Issues
- Issues
- Events
- Upcoming Events
The Power BI Data Visualization World Championships is back! Get ahead of the game and start preparing now! Learn more
- Power BI forums
- Forums
- Get Help with Power BI
- Desktop
- Re: Dynamic category on slicer section
- Subscribe to RSS Feed
- Mark Topic as New
- Mark Topic as Read
- Float this Topic for Current User
- Bookmark
- Subscribe
- Printer Friendly Page
- Mark as New
- Bookmark
- Subscribe
- Mute
- Subscribe to RSS Feed
- Permalink
- Report Inappropriate Content
Dynamic category on slicer section
Hello,
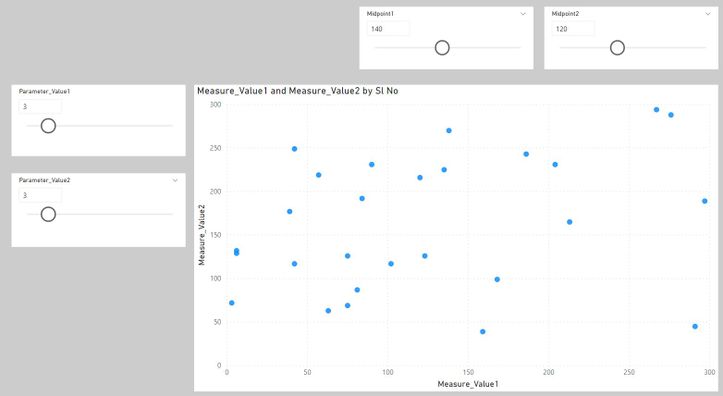
Please help me in creating a creating catogaries based on the mid point selections. For below scatter cart X and Y axis are calculated based on the slicers in left.
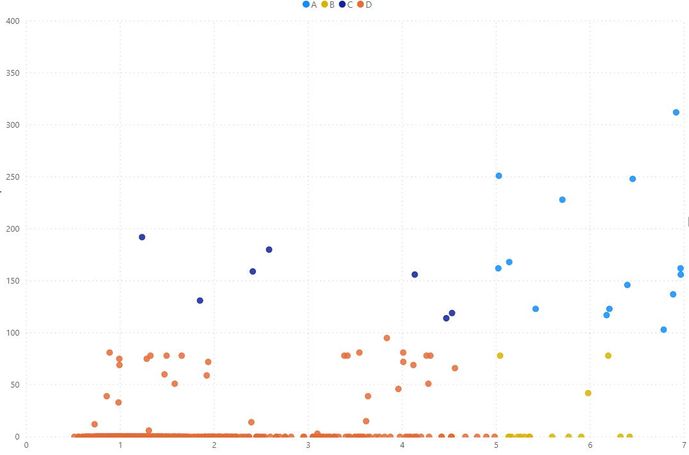
If the Midpoint1 = 140 and Midpoint2 = 120, all the dots in chart:
between 0 to 140 in X axis and 0 to 120 in Y axis will be Category A
Above 140 in X Axis and 0 to 120 in Y Axis will be Category B
Above 140 in X Axis and above 120 in Y axis will be Category C
0 to 140 in X Axis and Above 120 in Y axis will be Category D
Expected Output similar to:
Please help me with the logic.
Sample file: https://www.dropbox.com/s/hemibrwsquy0mhu/Catogary_Sample_PBI.pbix?dl=0
Solved! Go to Solution.
- Mark as New
- Bookmark
- Subscribe
- Mute
- Subscribe to RSS Feed
- Permalink
- Report Inappropriate Content
@vin26 , you have to create a measure like this example measure and use that in conditional formatting
Color Dot =
	var _avgDisc = CALCULATE([Discount %],ALL(Retail))
	var _avgMargin = CALCULATE([Margin %],ALL(Retail))
	return switch(TRUE(),
	[Margin %]>_avgMargin && [Discount %] <_avgDisc , "Green",
	[Margin %]>_avgMargin && [Discount %] >_avgDisc , "Blue",
	[Margin %]<_avgMargin && [Discount %] <_avgDisc , "Yellow",
	[Margin %]<_avgMargin && [Discount %] >_avgDisc , "Red", "Black")
I have explained how to do it in this webinar
https://youtu.be/Q1vPWmfI25o?t=2851
- Mark as New
- Bookmark
- Subscribe
- Mute
- Subscribe to RSS Feed
- Permalink
- Report Inappropriate Content
@vin26 - I think it is because of your logical expressions, perhaps:
Measure =
    var _avgDisc = CALCULATE('Midpoint1_X Axis'[Midpoint1 Value],ALL(Data))
	var _avgMargin = CALCULATE('Midpoint2_Y Axis'[Midpoint2 Value],ALL(Data))
        return
            switch(MAX('Table'[Category]),
                "A",CALCULATE(COUNT(Data[Sl No]),FILTER(Data,[Measure_Value1]>_avgMargin && [Measure_Value2] <_avgDisc)),
                "B",CALCULATE(COUNT(Data[Sl No]),FILTER(Data,[Measure_Value1]>_avgMargin && [Measure_Value2] >_avgDisc)),
                "C",CALCULATE(COUNT(Data[Sl No]),FILTER(Data,[Measure_Value1]<_avgMargin && [Measure_Value2] <_avgDisc)),
                "D",CALCULATE(COUNT(Data[Sl No]),FILTER(Data,[Measure_Value1]<_avgMargin && [Measure_Value2] >_avgDisc))
            )
If not, maybe try eliminating some CALCULATE statements:
Measure =
    var _avgDisc = CALCULATE('Midpoint1_X Axis'[Midpoint1 Value],ALL(Data))
	var _avgMargin = CALCULATE('Midpoint2_Y Axis'[Midpoint2 Value],ALL(Data))
        return
            switch(MAX('Table'[Category]),
                "A",COUNTROWS(FILTER(Data,[Measure_Value1]>_avgMargin && [Measure_Value2] <_avgDisc)),
                "B",COUNTROWS(FILTER(Data,[Measure_Value1]>_avgMargin && [Measure_Value2] >_avgDisc)),
                "C",COUNTROWS(FILTER(Data,[Measure_Value1]<_avgMargin && [Measure_Value2] <_avgDisc)),
                "D",COUNTROWS(FILTER(Data,[Measure_Value1]<_avgMargin && [Measure_Value2] >_avgDisc))
            )
Follow on LinkedIn
@ me in replies or I'll lose your thread!!!
Instead of a Kudo, please vote for this idea
Become an expert!: Enterprise DNA
External Tools: MSHGQM
YouTube Channel!: Microsoft Hates Greg
Latest book!: DAX For Humans
DAX is easy, CALCULATE makes DAX hard...
- Mark as New
- Bookmark
- Subscribe
- Mute
- Subscribe to RSS Feed
- Permalink
- Report Inappropriate Content
Hi @vin26 ,
As @Greg_Deckler said ,you could use SWITCH() or use IF()function like this:
categoryType =
IF (
    [forX] >= 0
        && [forX] <= 140
        && [forY] >= 0
        && [forY] <= 120,
    "Categoty A",
    IF (
        [forX] > 140
            && [forY] >= 0
            && [forY] >= 0
            && [forY] <= 120,
        "Category B",
        IF (
            [forX] > 140
                && [forY] > 120,
            "Category C",
            IF ( [forX] >= 0 && [forX] <= 140 && [forY] > 120, "Category D" )
        )
    )
)
Did I answer your question ? Please mark my reply as solution. Thank you very much.
If not, please upload some insensitive data samples and expected output.
Best Regards,
Eyelyn Qin
- Mark as New
- Bookmark
- Subscribe
- Mute
- Subscribe to RSS Feed
- Permalink
- Report Inappropriate Content
@vin26 , you have to create a measure like this example measure and use that in conditional formatting
Color Dot =
	var _avgDisc = CALCULATE([Discount %],ALL(Retail))
	var _avgMargin = CALCULATE([Margin %],ALL(Retail))
	return switch(TRUE(),
	[Margin %]>_avgMargin && [Discount %] <_avgDisc , "Green",
	[Margin %]>_avgMargin && [Discount %] >_avgDisc , "Blue",
	[Margin %]<_avgMargin && [Discount %] <_avgDisc , "Yellow",
	[Margin %]<_avgMargin && [Discount %] >_avgDisc , "Red", "Black")
I have explained how to do it in this webinar
- Mark as New
- Bookmark
- Subscribe
- Mute
- Subscribe to RSS Feed
- Permalink
- Report Inappropriate Content
Hi @amitchandak thank you for this solution, it works fine for color changes in chart.
I would also require group the values by category, for that I have created a table with categories and created a measure like below:
Measure =
    var _avgDisc = CALCULATE('Midpoint1_X Axis'[Midpoint1 Value],ALL(Data))
	var _avgMargin = CALCULATE('Midpoint2_Y Axis'[Midpoint2 Value],ALL(Data))
        return
            switch(MAX('Table'[Category]),
                "A",CALCULATE(COUNT(Data[Sl No]),[Measure_Value1]>_avgMargin && [Measure_Value2] <_avgDisc),
                "B",CALCULATE(COUNT(Data[Sl No]),[Measure_Value1]>_avgMargin && [Measure_Value2] >_avgDisc),
                "C",CALCULATE(COUNT(Data[Sl No]),[Measure_Value1]<_avgMargin && [Measure_Value2] <_avgDisc),
                "D",CALCULATE(COUNT(Data[Sl No]),[Measure_Value1]<_avgMargin && [Measure_Value2] >_avgDisc)
            )
it is not working and getting below error:

- Mark as New
- Bookmark
- Subscribe
- Mute
- Subscribe to RSS Feed
- Permalink
- Report Inappropriate Content
@vin26 - I think it is because of your logical expressions, perhaps:
Measure =
    var _avgDisc = CALCULATE('Midpoint1_X Axis'[Midpoint1 Value],ALL(Data))
	var _avgMargin = CALCULATE('Midpoint2_Y Axis'[Midpoint2 Value],ALL(Data))
        return
            switch(MAX('Table'[Category]),
                "A",CALCULATE(COUNT(Data[Sl No]),FILTER(Data,[Measure_Value1]>_avgMargin && [Measure_Value2] <_avgDisc)),
                "B",CALCULATE(COUNT(Data[Sl No]),FILTER(Data,[Measure_Value1]>_avgMargin && [Measure_Value2] >_avgDisc)),
                "C",CALCULATE(COUNT(Data[Sl No]),FILTER(Data,[Measure_Value1]<_avgMargin && [Measure_Value2] <_avgDisc)),
                "D",CALCULATE(COUNT(Data[Sl No]),FILTER(Data,[Measure_Value1]<_avgMargin && [Measure_Value2] >_avgDisc))
            )
If not, maybe try eliminating some CALCULATE statements:
Measure =
    var _avgDisc = CALCULATE('Midpoint1_X Axis'[Midpoint1 Value],ALL(Data))
	var _avgMargin = CALCULATE('Midpoint2_Y Axis'[Midpoint2 Value],ALL(Data))
        return
            switch(MAX('Table'[Category]),
                "A",COUNTROWS(FILTER(Data,[Measure_Value1]>_avgMargin && [Measure_Value2] <_avgDisc)),
                "B",COUNTROWS(FILTER(Data,[Measure_Value1]>_avgMargin && [Measure_Value2] >_avgDisc)),
                "C",COUNTROWS(FILTER(Data,[Measure_Value1]<_avgMargin && [Measure_Value2] <_avgDisc)),
                "D",COUNTROWS(FILTER(Data,[Measure_Value1]<_avgMargin && [Measure_Value2] >_avgDisc))
            )
Follow on LinkedIn
@ me in replies or I'll lose your thread!!!
Instead of a Kudo, please vote for this idea
Become an expert!: Enterprise DNA
External Tools: MSHGQM
YouTube Channel!: Microsoft Hates Greg
Latest book!: DAX For Humans
DAX is easy, CALCULATE makes DAX hard...
- Mark as New
- Bookmark
- Subscribe
- Mute
- Subscribe to RSS Feed
- Permalink
- Report Inappropriate Content
- Mark as New
- Bookmark
- Subscribe
- Mute
- Subscribe to RSS Feed
- Permalink
- Report Inappropriate Content
@vin26 - Seems like you could create a column like:
Column =
  VAR __MidX = <calculate mid>
  VAR __MidY = <calculate mid>
RETURN
  SWITCH(TRUE(),
    <logical criteria 1>,"Category 1",
    <logical criteria 2>,"Category 2",
    <logical criteria 3>,"Category 3",
    <logical criteria 4>,"Category 4",
  )
Follow on LinkedIn
@ me in replies or I'll lose your thread!!!
Instead of a Kudo, please vote for this idea
Become an expert!: Enterprise DNA
External Tools: MSHGQM
YouTube Channel!: Microsoft Hates Greg
Latest book!: DAX For Humans
DAX is easy, CALCULATE makes DAX hard...
Helpful resources

Power BI Dataviz World Championships
The Power BI Data Visualization World Championships is back! Get ahead of the game and start preparing now!

| User | Count |
|---|---|
| 37 | |
| 37 | |
| 33 | |
| 32 | |
| 29 |
| User | Count |
|---|---|
| 130 | |
| 88 | |
| 82 | |
| 68 | |
| 64 |


