Fabric Data Days starts November 4th!
Advance your Data & AI career with 50 days of live learning, dataviz contests, hands-on challenges, study groups & certifications and more!
Get registered- Power BI forums
- Get Help with Power BI
- Desktop
- Service
- Report Server
- Power Query
- Mobile Apps
- Developer
- DAX Commands and Tips
- Custom Visuals Development Discussion
- Health and Life Sciences
- Power BI Spanish forums
- Translated Spanish Desktop
- Training and Consulting
- Instructor Led Training
- Dashboard in a Day for Women, by Women
- Galleries
- Data Stories Gallery
- Themes Gallery
- Contests Gallery
- Quick Measures Gallery
- Visual Calculations Gallery
- Notebook Gallery
- Translytical Task Flow Gallery
- TMDL Gallery
- R Script Showcase
- Webinars and Video Gallery
- Ideas
- Custom Visuals Ideas (read-only)
- Issues
- Issues
- Events
- Upcoming Events
Get Fabric Certified for FREE during Fabric Data Days. Don't miss your chance! Learn more
- Power BI forums
- Forums
- Get Help with Power BI
- Desktop
- Dynamic Value
- Subscribe to RSS Feed
- Mark Topic as New
- Mark Topic as Read
- Float this Topic for Current User
- Bookmark
- Subscribe
- Printer Friendly Page
- Mark as New
- Bookmark
- Subscribe
- Mute
- Subscribe to RSS Feed
- Permalink
- Report Inappropriate Content
Dynamic Value
Hello All,
My requirement is to identify a group of age from an age column using a filter. While the filter value is 10 means, I want the x-axis value as the sum of 10 like 0-10,10-20......etc.depends upon data.
Actually, I did this one with static data by using the age group method in the table.
But I want to generate age difference(0-10,10-20......) dynamically based on slicer value, without static data how can I achieve this one.
Please help with this one. Thanks in advance.
Solved! Go to Solution.
- Mark as New
- Bookmark
- Subscribe
- Mute
- Subscribe to RSS Feed
- Permalink
- Report Inappropriate Content
Hi @Anonymous ,
Here are the steps you can follow:
1. Use column [Attribute] as slicer.
2. Create measure.
measure_value =
var _select =SELECTEDVALUE('Table'[Attribute])
var _age1=SUMX(FILTER('Table','Table'[Attribute]=_select),[Age]
var _age2=_age1+_select
var _age3=_age1-_select
return
SWITCH(
    TRUE(),
_select in {2,5,6},_age1 &"-"& _age2,
_select in {3,4} ,_age3 &"-"& _age1)
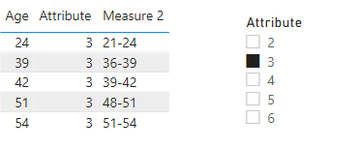
3. Result:
When Attribute=2 is selected, it is displayed as:
When Attribute= 3 is selected, it is displayed as:
Best Regards,
Liu Yang
If this post helps, then please consider Accept it as the solution to help the other members find it more quickly
- Mark as New
- Bookmark
- Subscribe
- Mute
- Subscribe to RSS Feed
- Permalink
- Report Inappropriate Content
@Anonymous , Power Bi Axis has come from some static columns at the end. while you can create a measure with those values. I doubt you can use that on axis
Helpful resources

Fabric Data Days
Advance your Data & AI career with 50 days of live learning, contests, hands-on challenges, study groups & certifications and more!

Power BI Monthly Update - October 2025
Check out the October 2025 Power BI update to learn about new features.


