Join the Fabric User Panel to shape the future of Fabric.
Share feedback directly with Fabric product managers, participate in targeted research studies and influence the Fabric roadmap.
Sign up now- Power BI forums
- Get Help with Power BI
- Desktop
- Service
- Report Server
- Power Query
- Mobile Apps
- Developer
- DAX Commands and Tips
- Custom Visuals Development Discussion
- Health and Life Sciences
- Power BI Spanish forums
- Translated Spanish Desktop
- Training and Consulting
- Instructor Led Training
- Dashboard in a Day for Women, by Women
- Galleries
- Data Stories Gallery
- Themes Gallery
- Contests Gallery
- QuickViz Gallery
- Quick Measures Gallery
- Visual Calculations Gallery
- Notebook Gallery
- Translytical Task Flow Gallery
- TMDL Gallery
- R Script Showcase
- Webinars and Video Gallery
- Ideas
- Custom Visuals Ideas (read-only)
- Issues
- Issues
- Events
- Upcoming Events
Get Fabric certified for FREE! Don't miss your chance! Learn more
- Power BI forums
- Forums
- Get Help with Power BI
- Desktop
- Dynamic Trend Line with LINESTX
- Subscribe to RSS Feed
- Mark Topic as New
- Mark Topic as Read
- Float this Topic for Current User
- Bookmark
- Subscribe
- Printer Friendly Page
- Mark as New
- Bookmark
- Subscribe
- Mute
- Subscribe to RSS Feed
- Permalink
- Report Inappropriate Content
Dynamic Trend Line with LINESTX
Hi,
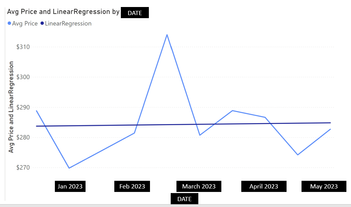
I am hoping that the new release of LINESTX function makes this request more reasonable. I would like to create a measure to be used as trend line (linear regression) on a the line visual. My x-axis is my date table that will have the normal granularity options (Date, Week, Month, QTR). The y-axis is a measure that is an aggregate from a sales table. The sales table provide transaction level details (all transactions each day).
The expected output would allow me filter the visual by fields in both the date table and sales table
- Change X Axis to day, week, month, etc (Date Table)
- Change Y Axis to specific regions, customer codes, items (Sales Table)
Lastly, from my reading it does seem needed to be able to reflect a direction of the reggressional analysis and my date table does have those index fields in 'DateKey', 'YearMonthNumber', etc.
y-axis measure would be [Avg Unit Price]
Unit Price =
SUM( 'Sales History'[Unit Price BC] )

Invoices =
COUNTROWS( 'Sales History' )

Avg Unit Price =
DIVIDE( [Unit Price], [Invoices], 0 )
Attempts:
Trend =
VAR dateset =
    FILTER(
        SELECTCOLUMNS(
            ALLSELECTED( 'Sales History' ),
            "Known[X]", 'Sales History'[Invoice Date],
            "Known[Y]", [Avg Unit Price]
            ),
            NOT( ISBLANK( [Avg Unit Price] ) )
            )
VAR line =
    LINESTX(dateset, Known[Y], Known[X])
VAR slope =
    SELECTCOLUMNS( line, [Slope1] )
VAR Intercept =
    SELECTCOLUMNS( line, [Intercept] )
VAR x = SELECTEDVALUE( 'Sales History'[Invoice Date] )
VAR y = x * slope + Intercept
RETURN y

Trend2 =
VAR Known =
    FILTER (
        SELECTCOLUMNS (
            CALCULATETABLE ( VALUES ( 'Date'[Date] ), ALLSELECTED ('Date') ),
            "Known[X]", 'Date'[Date],
            "Known[Y]", [Avg Unit Price]
        ),
        AND ( NOT ( ISBLANK ( Known[X] ) ), NOT ( ISBLANK ( Known[Y] ) ) )
    )
VAR Count_Items =
    COUNTROWS ( Known )
VAR Sum_X =
    SUMX ( Known, Known[X] )
VAR Sum_X2 =
    SUMX ( Known, Known[X] ^ 2 )
VAR Sum_Y =
    SUMX ( Known, Known[Y] )
VAR Sum_XY =
    SUMX ( Known, Known[X] * Known[Y] )
VAR Average_X =
    AVERAGEX ( Known, Known[X] )
VAR Average_Y =
    AVERAGEX ( Known, Known[Y] )
VAR Slope =
    DIVIDE (
        Count_Items * Sum_XY - Sum_X * Sum_Y,
        Count_Items * Sum_X2 - Sum_X ^ 2
    )
VAR Intercept = Average_Y
    - Slope * Average_X
RETURN
    SUMX ( DISTINCT ( 'Date'[Date] ),
    Intercept + Slope * 'Date'[Date]
)
Related Articles:
https://www.sqlbi.com/articles/implementing-linear-regression-in-power-bi/
https://learn.microsoft.com/en-us/dax/linestx-function-dax
https://kerrykolosko.com/kpi-trend-indicators-on-core-visuals/
https://community.fabric.microsoft.com/t5/Desktop/DAX-to-create-a-Trend-line/m-p/400663#M183065
- Mark as New
- Bookmark
- Subscribe
- Mute
- Subscribe to RSS Feed
- Permalink
- Report Inappropriate Content
Can you please reframe your request? What exactly are you asking for?
- Mark as New
- Bookmark
- Subscribe
- Mute
- Subscribe to RSS Feed
- Permalink
- Report Inappropriate Content
I would like to create a measure to be used as trend line.
- Mark as New
- Bookmark
- Subscribe
- Mute
- Subscribe to RSS Feed
- Permalink
- Report Inappropriate Content
Please provide sample data (with sensitive information removed) that covers your issue or question completely, in a usable format (not as a screenshot).
https://community.fabric.microsoft.com/t5/Community-Blog/How-to-provide-sample-data-in-the-Power-BI-...
Please show the expected outcome based on the sample data you provided.
https://community.fabric.microsoft.com/t5/Desktop/How-to-Get-Your-Question-Answered-Quickly/m-p/1447...
Helpful resources

Join our Fabric User Panel
Share feedback directly with Fabric product managers, participate in targeted research studies and influence the Fabric roadmap.

| User | Count |
|---|---|
| 59 | |
| 51 | |
| 42 | |
| 18 | |
| 14 |
| User | Count |
|---|---|
| 111 | |
| 104 | |
| 35 | |
| 27 | |
| 27 |
