Forum Discussion

Dual axis chart - lines only?
Hello - I frequently come across scenarios where I want to show line graphs but they have different magnitudes. I know how to make a dual axis chart with a line + column combo, but I can't find the option to make a line-only version work. (Excel can easily do this however.)
An example I'm dealing with is where I'd have an absolute measure (such as $ amount of annual GDP) on the left y axis and the YoY % measure on the right y axis.
Again, this has to be lines for both. Thanks in advance for the help!
-Matt
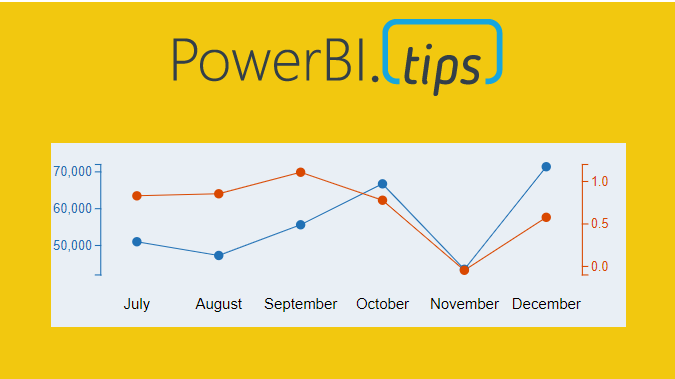
You can use the charticulator,
Here's a tutorial on how to make what you want. There's also included a github link with the finished visual if you want.
Thanks!
Appreciate your Kudos
Connect with me!



8 Replies
- AnonymousNot applicableHi,
Did you try Multiple axis chart in Power BI?- AnonymousNot applicable
Anonymous Show me where that is please? Not sure what you are referring to
- AnonymousNot applicableSearch Marketplace Visuals for Multiple Axis Chart - XViz and give it a try. You can search and add marketplace visuals from Power BI desktop.
- SteveCampbell
Memorable Member
You can use the charticulator,
Here's a tutorial on how to make what you want. There's also included a github link with the finished visual if you want.
Thanks!
Appreciate your Kudos
Connect with me!- AnonymousNot applicable
Hi SteveCampbell ,
This charticulator is only for csv files, but if somebody is making dashboards using oracle database live data, then it is not possible to use charticulator.
Am i right ?
Is there any provision for the same ?
Thanks !- SteveCampbellThe tool can use any data source. You will use csv field to design it if you make it in the site.
It will export a custom visual that you can use in power bi with any data, just like any other visual.
There’s a custom visual available to download already built on that link, so you can try it without having to make one yourself.