Get certified for free when you join Fabric Data Days 2026 and dive into Fabric, Power BI, SQL, AI, and other essential data skills.
Join nowJuly 7 - July 17 | Round 2 of the Power BI Dataviz World Championships. Don't miss your chance! Learn more
Hi, I have designed an Power BI report with Mapbox visual , enabling chloropeth.
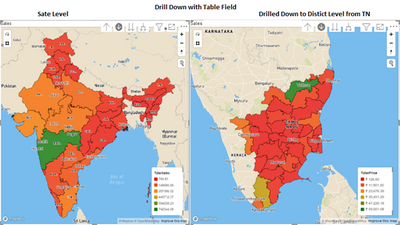
When I drill down through the chloropeth layers, mapping the data field (Total Price- Direct table field) in colour. Trying to drill down from state level to district level. The drill down is working as expected.
When I drill down through the chloropeth layers, mapping the calculate dmesure (Total Sales) in colour. Trying to drill down from state level to district level. The drill down is not filtering and focusing on districts of TN alone and zoom level is set to entire districts of India. Instead of zooming TN districts.
Kindly suggest to resolve the Zoom & focusing issue.
Hi @ssubramani ,
It will be very helpful if you can provide more information, such as the fields you drill down and the desired result. Of course, it is better if you can share your PBIX files.
Best Regards,
Winniz
Join us in Barcelona for FabCon and SQLCon, the Fabric, Power BI, SQL, and AI community event. Save €200 with code FABCMTY200.
Join Data Days 2026: 60 days of free live/on-demand sessions, challenges, study groups, and certification opportunities.
| User | Count |
|---|---|
| 29 | |
| 27 | |
| 24 | |
| 24 | |
| 18 |
| User | Count |
|---|---|
| 54 | |
| 50 | |
| 41 | |
| 33 | |
| 25 |