Fabric Data Days starts November 4th!
Advance your Data & AI career with 50 days of live learning, dataviz contests, hands-on challenges, study groups & certifications and more!
Get registered- Power BI forums
- Get Help with Power BI
- Desktop
- Service
- Report Server
- Power Query
- Mobile Apps
- Developer
- DAX Commands and Tips
- Custom Visuals Development Discussion
- Health and Life Sciences
- Power BI Spanish forums
- Translated Spanish Desktop
- Training and Consulting
- Instructor Led Training
- Dashboard in a Day for Women, by Women
- Galleries
- Data Stories Gallery
- Themes Gallery
- Contests Gallery
- QuickViz Gallery
- Quick Measures Gallery
- Visual Calculations Gallery
- Notebook Gallery
- Translytical Task Flow Gallery
- TMDL Gallery
- R Script Showcase
- Webinars and Video Gallery
- Ideas
- Custom Visuals Ideas (read-only)
- Issues
- Issues
- Events
- Upcoming Events
Get Fabric Certified for FREE during Fabric Data Days. Don't miss your chance! Request now
- Power BI forums
- Forums
- Get Help with Power BI
- Desktop
- Re: Displaying all values instead of first or last...
- Subscribe to RSS Feed
- Mark Topic as New
- Mark Topic as Read
- Float this Topic for Current User
- Bookmark
- Subscribe
- Printer Friendly Page
- Mark as New
- Bookmark
- Subscribe
- Mute
- Subscribe to RSS Feed
- Permalink
- Report Inappropriate Content
Displaying all values instead of first or last values in Matrix
Hi,
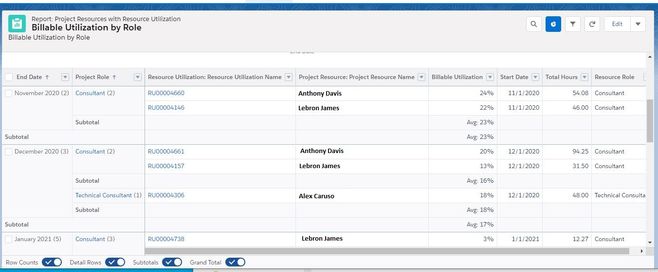
I have a report in Salesforce that I want to duplicate in Power BI. It shows the billable utilization by role and it's grouped by the project role and end date. (I've changed the resource names for privacy):
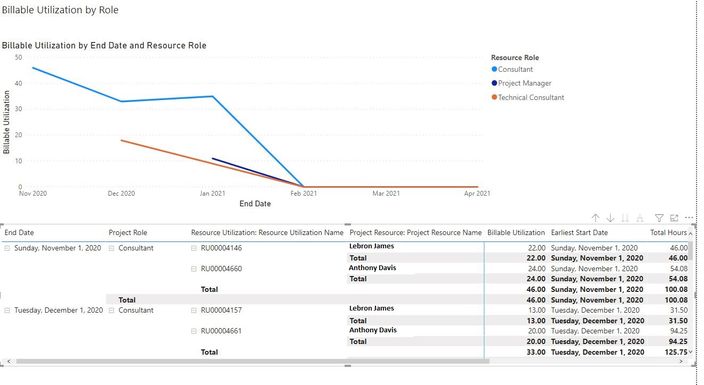
In Power BI, I used a matrix visualuzation to try to group by the role and end dates. However when I try to add the other fields in the values section, it would only allow me to select the first or last record.
I ended up grouping by the utilization and resource names as well to make reports similar looking (e.g. moving them to the rows section of the matrix), but I'd rather have these 2 fields in the values. If I move these 2 fields to the values section, only 1 resource name would appear (which one seems to be random) and the billable utilization is combined. (it looks like 1 resource name has all the utilization.
I was wondering how do I make the reports look similar to what is in Salesforce? I looked into the "CONCATENATEX" function, but this returns a comma delimited list of the names. I want them displayed in separate rows.
Sincerely,
Jason
- Mark as New
- Bookmark
- Subscribe
- Mute
- Subscribe to RSS Feed
- Permalink
- Report Inappropriate Content
Hi @jasonyeung87,
Aggregate values are the basic mechanism of matrix visual, you can't force them to show all values without 'aggregation'.
CONCATENATEX function can be used to combine a list of the text values, it does not suitable to expand these values to a new row/column.
BTW, measure expression not support to return different data types at the same time except you convert them to text values before return.
Regards,
Xiaoxin Sheng
- Mark as New
- Bookmark
- Subscribe
- Mute
- Subscribe to RSS Feed
- Permalink
- Report Inappropriate Content
@jasonyeung87 , I matrix visual values the values need to be summarized. If you do not need a column(pivot) then you can use the table visual. Or you have to keep the values in the row or column.
- Mark as New
- Bookmark
- Subscribe
- Mute
- Subscribe to RSS Feed
- Permalink
- Report Inappropriate Content
Hi @amitchandak ,
I tried using tables and although it displays the data correctly, it displays the same end date and project rolws multiple times. In the example below, the first 2 records are for Nov.2020 and this appears for both records. I want Nov.2020 to appear in just the first row. (the matrix seems to allow for this, but it summarises the other data).
Helpful resources

Fabric Data Days
Advance your Data & AI career with 50 days of live learning, contests, hands-on challenges, study groups & certifications and more!

Power BI Monthly Update - October 2025
Check out the October 2025 Power BI update to learn about new features.


