cancel
Showing results for 
Search instead for 
Did you mean: 

A new Data Days event is coming soon! This time we’re going bigger than ever. Fabric, Power BI, SQL, AI and more. Don't miss out.

Reply
Anonymous
Not applicable

Displaying Matrix visual values in multiple columns

I have student data for 10 schools. I am trying to calculate and display in a matrix visual the student strength by level of education they are in.


I have data as below:


School Name        Class            Strength

AAA                      Grade 9            20

AAA                      Grade 10          35

AAA                      Grade 11          12

AAA                      Grade 12           5

BBB                       Grade 9            20

BBB                       Grade 10          55

BBB                       Grade 11          25

BBB                       Grade 12          14

CCC                       Grade 9            20

CCC                      Grade 10           45

CCC                      Grade 11           15

CCC                       Grade 12          14


I want to see the display the data in the matrix as follows


School Name      FS (Combined 9 and 10)       JS (Combined 11 and 12)

AAA

BBB

CCC


I know this might be too easy. But rookie here. Thanks.

1 ACCEPTED SOLUTION
v-yuta-msft
Community Support
Community Support

@Anonymous ,


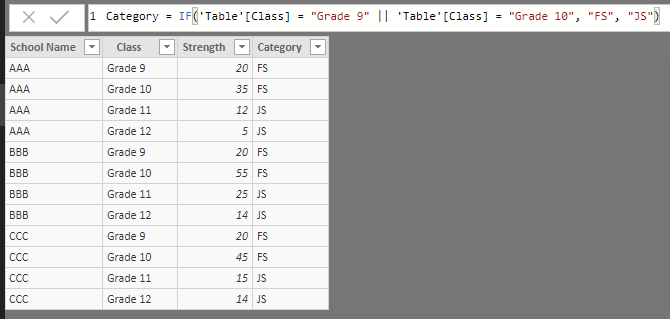
Firstly, create an additional column "Category" using DAX below:

Category = IF('Table'[Class] = "Grade 9" || 'Table'[Class] = "Grade 10", "FS", "JS")

1.PNG 

Then create a matrix visual, drag Category to Columns, School Name to Rows and Strength to Values.

2.PNG 


Community Support Team _ Jimmy Tao

If this post helps, then please consider Accept it as the solution to help the other members find it more quickly.

View solution in original post

4 REPLIES 4
v-yuta-msft
Community Support
Community Support

@Anonymous ,


Firstly, create an additional column "Category" using DAX below:

Category = IF('Table'[Class] = "Grade 9" || 'Table'[Class] = "Grade 10", "FS", "JS")

1.PNG 

Then create a matrix visual, drag Category to Columns, School Name to Rows and Strength to Values.

2.PNG 


Community Support Team _ Jimmy Tao

If this post helps, then please consider Accept it as the solution to help the other members find it more quickly.

v-yuta-msft
Community Support
Community Support

@Anonymous ,


What does "Combined 9 and 10" and "Combined 11 and 12" mean? Could you share more details about the logic?


Regards,

Jimmy Tao

Anonymous
Not applicable

@v-yuta-msft 


Combined means to add the strength of both classes. So basically, in our system, we have two categories


Category A (Grade 9 and 10)

Category B (Grade 11 and 12)

Anonymous
Not applicable

anyone?

Helpful resources

Announcements
May Power BI Update Carousel

Power BI Monthly Update - May 2026

Check out the May 2026 Power BI update to learn about new features.

Fabric SQL PBI Data Days

Data Days 2026 coming soon!

Sign up to receive a private message when registration opens and key events begin.

New to Fabric survey Carousel

New to Fabric Survey

If you have recently started exploring Fabric, we'd love to hear how it's going. Your feedback can help with product improvements.

Power BI DataViz World Championships carousel

Power BI DataViz World Championships - June 2026

A new Power BI DataViz World Championship is coming this June! Don't miss out on submitting your entry.