cancel
Showing results for 
Search instead for 
Did you mean: 

July 28 - August 9 | Final Round of the Power BI Dataviz World Championships. This is your chance. Learn more

Reply
bbulla
Frequent Visitor

Direct Query help

Hi,


So I am using a Direct Query to bring in some inspection information for catch basins.  Basically I have two tables;  one with all of our catchbasins (id of each one = FACILITYID) and another with inspection information.  My query joins the two tables on FACILITYID and then shows all of the catchbasins along with the most recent inspection date (INSP_DATE).  If there is no inspection done on it yet, the INSP_DATE is null.   


SELECT works.SSCATCHBASIN.FACILITYID, Max(works.INSPECTIONS_CATCHBASIN_INSPECTION.INSP_DATE) AS MaxOfINSP_DATE, works.SSCATCHBASIN.DEPOTAREA
FROM works.SSCATCHBASIN LEFT JOIN works.INSPECTIONS_CATCHBASIN_INSPECTION ON works.SSCATCHBASIN.FACILITYID = works.INSPECTIONS_CATCHBASIN_INSPECTION.FACILITYID
GROUP BY works.SSCATCHBASIN.FACILITYID, works.SSCATCHBASIN.LIFECYCLESTATUS, works.SSCATCHBASIN.DEPOTAREA
HAVING (((works.SSCATCHBASIN.LIFECYCLESTATUS)='ASSUMED' Or (works.SSCATCHBASIN.LIFECYCLESTATUS)='ISSUED FOR CONSTRUCTION' Or (works.SSCATCHBASIN.LIFECYCLESTATUS)='MAINTENANCE'));


So the end table is basically all catchbasins with the most recent inspection, with a NULL date for those with no inspection.  


One problem I am having is that I cannot create a date hierarchy of MaxOfINSP_DATE field.  It's showing up as a valid Date/Time field in the Power Query Editor.  From what I've read this might be an issue with Direct Query, but I'm not totally sure.


I'd like to do this since I need to create a % inspected visual and I figure this would be the easiest way to do it.  So for 2022, all catchbasins inspected in either 2022 or 2021 would be considered "inspected" and everything else (including NULL date) would be considered "uninspected".


Hopefully that makes sense.


I am a total newbie to Power BI, so please be gentle with me so perhaps my logic to this is totally wrong.  🙂

1 ACCEPTED SOLUTION
bbulla
Frequent Visitor

OMG!  I finally go this to work.  So I added 3 measures;  1 for CatchBasin count (CB_Count), 1 for the Inspection count (INSP_Count) and 1 to calculate the % completed (PercentComplete).


CB_Count = calculate(COUNT(CatchBasin_Inspections[FACILITYID]))
 
INSP_Count = CALCULATE(DISTINCTCOUNTNOBLANK(CatchBasin_Inspections[MaxOfINSP_DATE]), FILTER(CatchBasin_Inspections, CatchBasin_Inspections[MaxOfINSP_DATE] >= date(2021, 01, 01)))
 
PercentComplete = calculate(DIVIDE(CatchBasin_Inspections[INSP_Count],CatchBasin_Inspections[CB_Count],0)*100)
 
Figuring out the FILTER on the INSP_Count part was the tricky part, but seems to solve the issue of only looking for dates within a specific time period.  I'll have to update that to not include anything beyond the end of 2022, but now it is good.
 
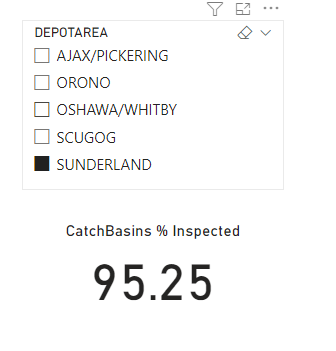
I also placed a slicer so that the user can select the service area and see the % completed within the specified area.


This only took me about 3 days!!  LOL


bbulla_0-1650649769451.png


View solution in original post

1 REPLY 1
bbulla
Frequent Visitor

OMG!  I finally go this to work.  So I added 3 measures;  1 for CatchBasin count (CB_Count), 1 for the Inspection count (INSP_Count) and 1 to calculate the % completed (PercentComplete).


CB_Count = calculate(COUNT(CatchBasin_Inspections[FACILITYID]))
 
INSP_Count = CALCULATE(DISTINCTCOUNTNOBLANK(CatchBasin_Inspections[MaxOfINSP_DATE]), FILTER(CatchBasin_Inspections, CatchBasin_Inspections[MaxOfINSP_DATE] >= date(2021, 01, 01)))
 
PercentComplete = calculate(DIVIDE(CatchBasin_Inspections[INSP_Count],CatchBasin_Inspections[CB_Count],0)*100)
 
Figuring out the FILTER on the INSP_Count part was the tricky part, but seems to solve the issue of only looking for dates within a specific time period.  I'll have to update that to not include anything beyond the end of 2022, but now it is good.
 
I also placed a slicer so that the user can select the service area and see the % completed within the specified area.


This only took me about 3 days!!  LOL


bbulla_0-1650649769451.png


Helpful resources

Announcements
Fabric Community Sticker Design Challenge Barcelona Carousel

Fabric Community Sticker Challenge - Barcelona 2026

If you love stickers, then you will definitely want to check out our community sticker challenge, Barcelona edition!

July Power BI Update Carousel

Power BI Monthly Update - July 2026

Check out the July 2026 Power BI update to learn about new features.

Power BI DataViz World Championships carousel

Power BI DataViz World Championships - June 2026

A new Power BI DataViz World Championship is coming this June! Don't miss out on submitting your entry.

Top Solution Authors