- Power BI forums
- Updates
- News & Announcements
- Get Help with Power BI
- Desktop
- Service
- Report Server
- Power Query
- Mobile Apps
- Developer
- DAX Commands and Tips
- Custom Visuals Development Discussion
- Health and Life Sciences
- Power BI Spanish forums
- Translated Spanish Desktop
- Power Platform Integration - Better Together!
- Power Platform Integrations (Read-only)
- Power Platform and Dynamics 365 Integrations (Read-only)
- Training and Consulting
- Instructor Led Training
- Dashboard in a Day for Women, by Women
- Galleries
- Community Connections & How-To Videos
- COVID-19 Data Stories Gallery
- Themes Gallery
- Data Stories Gallery
- R Script Showcase
- Webinars and Video Gallery
- Quick Measures Gallery
- 2021 MSBizAppsSummit Gallery
- 2020 MSBizAppsSummit Gallery
- 2019 MSBizAppsSummit Gallery
- Events
- Ideas
- Custom Visuals Ideas
- Issues
- Issues
- Events
- Upcoming Events
- Community Blog
- Power BI Community Blog
- Custom Visuals Community Blog
- Community Support
- Community Accounts & Registration
- Using the Community
- Community Feedback
Register now to learn Fabric in free live sessions led by the best Microsoft experts. From Apr 16 to May 9, in English and Spanish.
- Power BI forums
- Forums
- Get Help with Power BI
- Desktop
- Re: Deneb Visual Legend Filtration during filterin...
- Subscribe to RSS Feed
- Mark Topic as New
- Mark Topic as Read
- Float this Topic for Current User
- Bookmark
- Subscribe
- Printer Friendly Page
- Mark as New
- Bookmark
- Subscribe
- Mute
- Subscribe to RSS Feed
- Permalink
- Report Inappropriate Content
Deneb Visual Legend Filtration during filtering
Hello all!
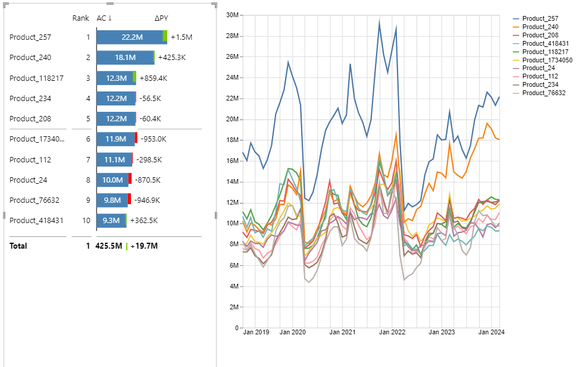
I have a some report with using Deneb Visual as replace a standard PowerBI Multiline Chart.
It`s works fine.

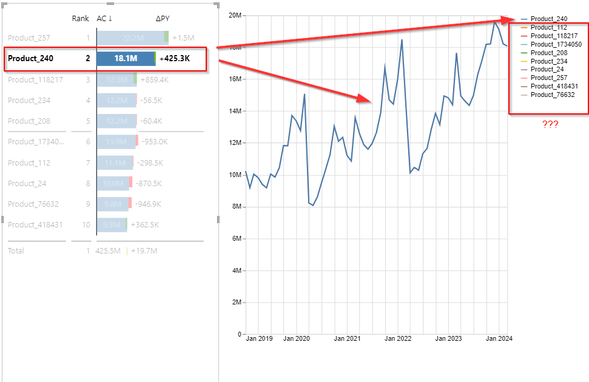
But there is a problem with the chart legend when I select the data in another visual.

Legend items are not filtered as expect. Selected item moved up, but another items still visible.
Does anyone know how to hide the filtered items in the legend.
Specification of the Chart
{
  "data": {"name": "dataset"},
  "transform": [
    {
      "calculate": "datum['Brand']",
      "as": "dim"
    },
    {
      "calculate": "isDefined(datum['Brand'])?datum['Brand']:datum.dim",
      "as": "dim"
    },
    {
      "calculate": "isDefined(datum['Market Org'])?datum['Market Org']:datum.dim",
      "as": "dim"
    },
    {
      "calculate": "isDefined(datum['Rx/OTC'])?datum['Rx/OTC']:datum.dim",
      "as": "dim"
    },
    {
      "calculate": "isDefined(datum['Category'])?datum['Category']:datum.dim",
      "as": "dim"
    },
    {
      "calculate": "isDefined(datum['SKU'])?datum['SKU']:datum.dim",
      "as": "dim"
    }
  ],
  "encoding": {
    "x": {
      "field": "date",
      "type": "temporal",
      "axis": {
        "format": "MMM yyyy",
        "formatType": "pbiFormat"
      }
    },
    "y": {
      "field": "ac",
      "type": "quantitative",
      "axis": {
        "labelExpr": "format(datum.value,data('dataset')[0]['ExprType']=='SO'?',.3~s':(data('dataset')[0]['ExprType']=='MS'?'0.0%':'0'))"
      }
    },
    "color": {
      "field": "dim",
      "type": "nominal",
      "sort": {
        "field": "ac",
        "order": "descending"
      }
    }
  },
  "layer": [
    {"mark": {"type": "line"}},
    {
      "mark": {"type": "line"},
      "params": [
        {
          "name": "hover",
          "select": {
            "type": "point",
            "on": "pointerover",
            "clear": "pointerout"
          }
        }
      ],
      "encoding": {
        "size": {
          "condition": {
            "test": {
              "param": "hover",
              "empty": false
            },
            "value": 4
          },
          "value": 1
        },
        "tooltip": [
          {
            "field": "date",
            "type": "temporal",
            "format": "MMM yyyy",
            "formatType": "pbiFormat"
          },
          {
            "field": "dim",
            "type": "nominal"
          },
          {
            "field": "ac",
            "type": "quantitative",
            "format": ",.3~s"
          }
        ]
      }
    }
  ]
}
Config
{
  "autosize": {
    "type": "fit",
    "contains": "padding"
  },
  "axisX": {
    "grid": true,
    "ticks": false,
    "domain": false,
    "title": false
  },
  "axisY": {
    "grid": true,
    "labels": true,
    "ticks": true,
    "domain": false,
    "title": false,
    "offset": 0
  },
  "legend": {"title": false}
}
Thanks!
Solved! Go to Solution.
- Mark as New
- Bookmark
- Subscribe
- Mute
- Subscribe to RSS Feed
- Permalink
- Report Inappropriate Content
I will answer myself.
Deneb doesn't fully match selection behavior like PowerBI does.
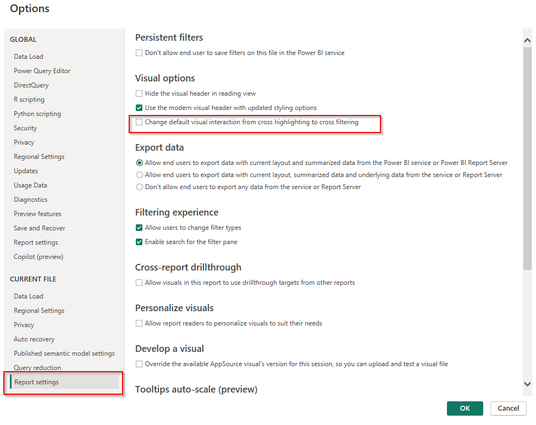
For fix this need go to Options and settings > Options > Report Settings and check this
"Change default visual interaction from cross highlighting to cross filtering".

Thanks for your attention!
- Mark as New
- Bookmark
- Subscribe
- Mute
- Subscribe to RSS Feed
- Permalink
- Report Inappropriate Content
I will answer myself.
Deneb doesn't fully match selection behavior like PowerBI does.
For fix this need go to Options and settings > Options > Report Settings and check this
"Change default visual interaction from cross highlighting to cross filtering".

Thanks for your attention!
Helpful resources

Microsoft Fabric Learn Together
Covering the world! 9:00-10:30 AM Sydney, 4:00-5:30 PM CET (Paris/Berlin), 7:00-8:30 PM Mexico City

Power BI Monthly Update - April 2024
Check out the April 2024 Power BI update to learn about new features.

| User | Count |
|---|---|
| 109 | |
| 108 | |
| 88 | |
| 75 | |
| 66 |
| User | Count |
|---|---|
| 125 | |
| 114 | |
| 98 | |
| 81 | |
| 73 |
