cancel
Showing results for 
Search instead for 
Did you mean: 

July 7 - July 17 | Round 2 of the Power BI Dataviz World Championships. Don't miss your chance! Learn more

Reply
Anonymous
Not applicable

Delta Between Rows for Multiple Column in a Matrix

Thanks in advance for any assistance you may provide.


I have a matrix in which I would like to calculate the difference (Delta) between rows in the matrix, by column.


Data

As Of Date	Error Type	Date Index
07/30/2019	Error Type 1	1
07/30/2019	Error Type 2	1
07/31/2019	Error Type 1	2
07/31/2019	Error Type 2	2
08/01/2019	Error Type 1	3
08/01/2019	Error Type 2	3
08/05/2019	Error Type 1	4
08/05/2019	Error Type 2	4

The data has several "Error Types" for each "As Of Date".


I created the Date Index column on the table for reference purposes in the Delta measure.

Date Index = RANKX('Data Errors' , 'Data Errors'[As Of Date] ,, ASC , Dense)


I created a Delta measure, but I don't know how to dynamically reference each Error Type. Note the hard refrence to "Error Type 1" (highlighted in red).

Delta = 
VAR PRIOR_COUNT = 
    VAR CURRENT_RANK = SELECTEDVALUE('Data Errors'[Date Index])
    RETURN 
        CALCULATE(COUNTROWS('Data Errors'),
            FILTER(
                FILTER(ALL('Data Errors'),'Data Errors'[Date Index]=CURRENT_RANK-1),
            'Data Errors'[Error Type]="Error Type 1"))
RETURN 
    COUNTROWS('Data Errors') - PRIOR_COUNT


Matrix (The second matrix to the right is to show the totals without a total for the Delta column.)
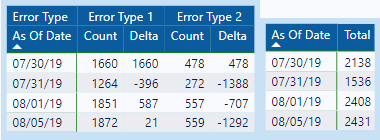
image.gif


The Delta column is correct for only the Error Type 1 column, because that is hardcoded into the measure.


Can, and will, someone please help me dynamically reference the Error Type in my measure so I can have a delta column for each Error Type in my table?


1 ACCEPTED SOLUTION
MFelix
Super User
Super User

Hi @Anonymous ,


To what I can understand from you question you want to have the result of the difference from one day to the other, believe that you don't need to have a rankx columns, try the following code:


Delta without RANK = 
VAR PRIOR_COUNT =
    CALCULATE (
        COUNTROWS ( 'Data Errors' );
        FILTER (
            ALL ( 'Data Errors'[As Of Date] );
            'Data Errors'[As Of Date]
                = MAXX (
                    FILTER (
                        ALL ( 'Data Errors'[As Of Date] );
                        'Data Errors'[As Of Date] < MAX ( 'Data Errors'[As Of Date] )
                    );
                    'Data Errors'[As Of Date]
                )
        )
    )
RETURN
    COUNTROWS ( 'Data Errors' ) - PRIOR_COUNT

When you add the error type on the columns this will give context to your measure.


Using the measure you have you need to redo it to:

Delta = 
VAR PRIOR_COUNT = 
    VAR CURRENT_RANK = SELECTEDVALUE('Data Errors'[Date Index])
    RETURN 
        CALCULATE(COUNTROWS('Data Errors');
            FILTER(
                FILTER(ALL('Data Errors');'Data Errors'[Date Index]  = CURRENT_RANK-1);
            'Data Errors'[Error Type]=SELECTEDVALUE('Data Errors'[Error Type])))
RETURN 
    COUNTROWS('Data Errors') - PRIOR_COUNT

The highleted part is the one that you had hardcoded.


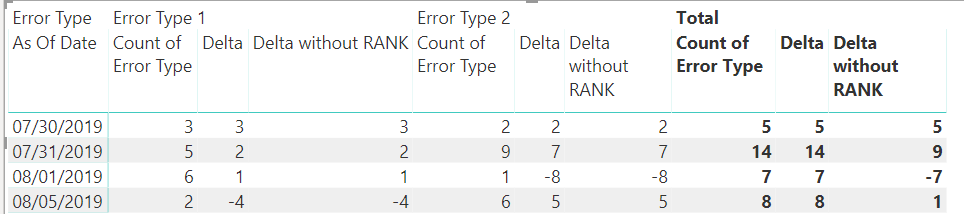
As you can see both results are the same.


count.png


Regards,

MFelix


Regards

Miguel Félix


Did I answer your question? Mark my post as a solution!

Proud to be a Super User!

Check out my blog: Power BI em Português


View solution in original post

2 REPLIES 2
MFelix
Super User
Super User

Hi @Anonymous ,


To what I can understand from you question you want to have the result of the difference from one day to the other, believe that you don't need to have a rankx columns, try the following code:


Delta without RANK = 
VAR PRIOR_COUNT =
    CALCULATE (
        COUNTROWS ( 'Data Errors' );
        FILTER (
            ALL ( 'Data Errors'[As Of Date] );
            'Data Errors'[As Of Date]
                = MAXX (
                    FILTER (
                        ALL ( 'Data Errors'[As Of Date] );
                        'Data Errors'[As Of Date] < MAX ( 'Data Errors'[As Of Date] )
                    );
                    'Data Errors'[As Of Date]
                )
        )
    )
RETURN
    COUNTROWS ( 'Data Errors' ) - PRIOR_COUNT

When you add the error type on the columns this will give context to your measure.


Using the measure you have you need to redo it to:

Delta = 
VAR PRIOR_COUNT = 
    VAR CURRENT_RANK = SELECTEDVALUE('Data Errors'[Date Index])
    RETURN 
        CALCULATE(COUNTROWS('Data Errors');
            FILTER(
                FILTER(ALL('Data Errors');'Data Errors'[Date Index]  = CURRENT_RANK-1);
            'Data Errors'[Error Type]=SELECTEDVALUE('Data Errors'[Error Type])))
RETURN 
    COUNTROWS('Data Errors') - PRIOR_COUNT

The highleted part is the one that you had hardcoded.


As you can see both results are the same.


count.png


Regards,

MFelix


Regards

Miguel Félix


Did I answer your question? Mark my post as a solution!

Proud to be a Super User!

Check out my blog: Power BI em Português


Anonymous
Not applicable

Hi @MFelix ,


Thanks so much. You're brilliant!! It worked perfectly... once I replaced your semicolons with commas. Smiley Tongue

Helpful resources

Announcements
FabCon and SQLCon Barcelona 2026

FabCon & SQLCon – Barcelona 2026

Join us in Barcelona for FabCon and SQLCon, the Fabric, Power BI, SQL, and AI community event. Save €200 with code FABCMTY200.

60 days of Data Days Carousel

Data Days 2026

Join Fabric Data Days 2026: 60 days of free live/on-demand sessions, challenges, study groups, and certification opportunities.

Power BI DataViz World Championships carousel

Power BI DataViz World Championships - June 2026

A new Power BI DataViz World Championship is coming this June! Don't miss out on submitting your entry.