Get certified for free when you join Fabric Data Days 2026 and dive into Fabric, Power BI, SQL, AI, and other essential data skills.
Join nowJuly 7 - July 17 | Round 2 of the Power BI Dataviz World Championships. Don't miss your chance! Learn more
Hello friends,
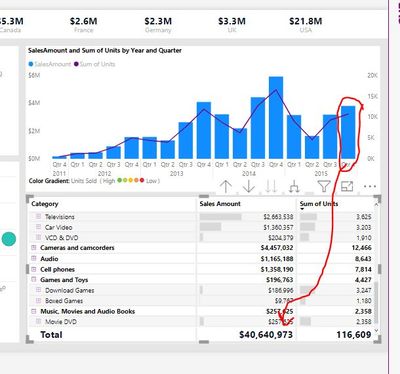
I want my table to show the numbers of the LAST MONTH only by default (when user opens the report)
But I want my users to be able to click on any bar on the upper chart so that the table shows the data FOR THAT SPECIFIC CHOSEN MONTH.
How do I achieve that efficiently?
Thanks!
Michael
Solved! Go to Solution.
Hi @Anonymous
You may try to create a measure like below:
Measure =
VAR a =
SUMMARIZE (
'Table',
'Table'[category],
"b", CALCULATE (
SUM ( 'Table'[Sales] ),
FILTER (
'Table',
MONTH ( 'Table'[Date] ) = MONTH ( MAXX ( 'Table', 'Table'[Date] ) )
)
)
)
RETURN
SUMX ( a, [b] )
Regards,
Cherie
Hi @Anonymous
You may try to create a measure like below:
Measure =
VAR a =
SUMMARIZE (
'Table',
'Table'[category],
"b", CALCULATE (
SUM ( 'Table'[Sales] ),
FILTER (
'Table',
MONTH ( 'Table'[Date] ) = MONTH ( MAXX ( 'Table', 'Table'[Date] ) )
)
)
)
RETURN
SUMX ( a, [b] )
Regards,
Cherie
Join us in Barcelona for FabCon and SQLCon, the Fabric, Power BI, SQL, and AI community event. Save €200 with code FABCMTY200.
Join Data Days 2026: 60 days of free live/on-demand sessions, challenges, study groups, and certification opportunities.
| User | Count |
|---|---|
| 26 | |
| 25 | |
| 19 | |
| 19 | |
| 15 |
| User | Count |
|---|---|
| 48 | |
| 46 | |
| 43 | |
| 36 | |
| 35 |