FabCon is coming to Atlanta
Join us at FabCon Atlanta from March 16 - 20, 2026, for the ultimate Fabric, Power BI, AI and SQL community-led event. Save $200 with code FABCOMM.
Register now!- Power BI forums
- Get Help with Power BI
- Desktop
- Service
- Report Server
- Power Query
- Mobile Apps
- Developer
- DAX Commands and Tips
- Custom Visuals Development Discussion
- Health and Life Sciences
- Power BI Spanish forums
- Translated Spanish Desktop
- Training and Consulting
- Instructor Led Training
- Dashboard in a Day for Women, by Women
- Galleries
- Data Stories Gallery
- Themes Gallery
- Contests Gallery
- Quick Measures Gallery
- Notebook Gallery
- Translytical Task Flow Gallery
- TMDL Gallery
- R Script Showcase
- Webinars and Video Gallery
- Ideas
- Custom Visuals Ideas (read-only)
- Issues
- Issues
- Events
- Upcoming Events
Calling all Data Engineers! Fabric Data Engineer (Exam DP-700) live sessions are back! Starting October 16th. Sign up.
- Power BI forums
- Forums
- Get Help with Power BI
- Desktop
- Re: Dax query returns unexpected result
- Subscribe to RSS Feed
- Mark Topic as New
- Mark Topic as Read
- Float this Topic for Current User
- Bookmark
- Subscribe
- Printer Friendly Page
- Mark as New
- Bookmark
- Subscribe
- Mute
- Subscribe to RSS Feed
- Permalink
- Report Inappropriate Content
Dax query returns unexpected result
Hi everyone,
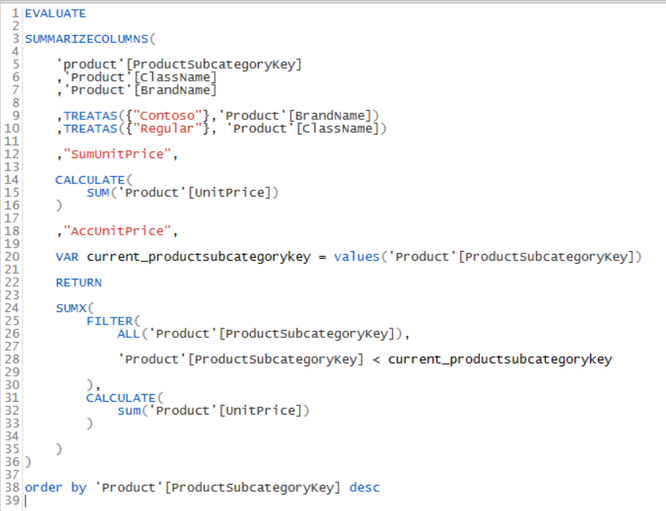
I have a pbix file ContosoSales-Excerpt.pbix being only 'Product' table of Contoso Sales sample. Then I made a Dax query by Dax Studio which calculates cumulative total of ‘Product’ [UnitPrice] by the ascending order of ‘Product’ [ProductSubCategoryKey].
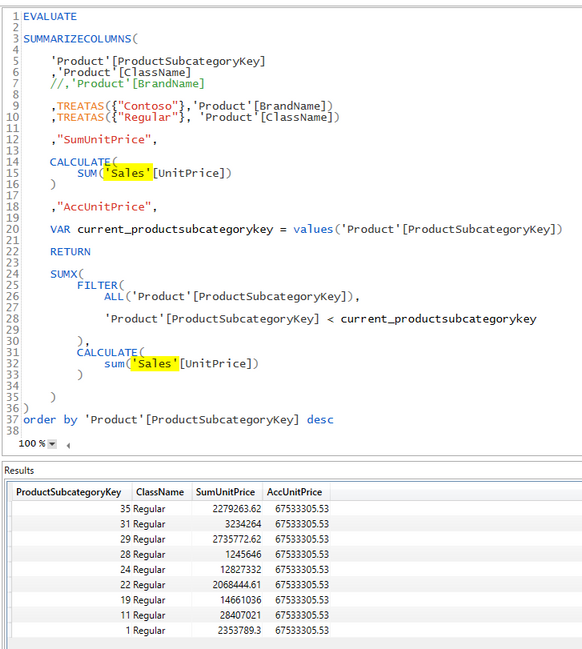
The query is simple enough as below.
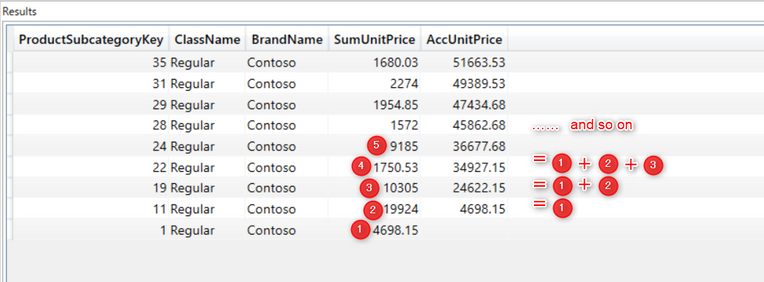
This works very fine as expected. It returns below as output
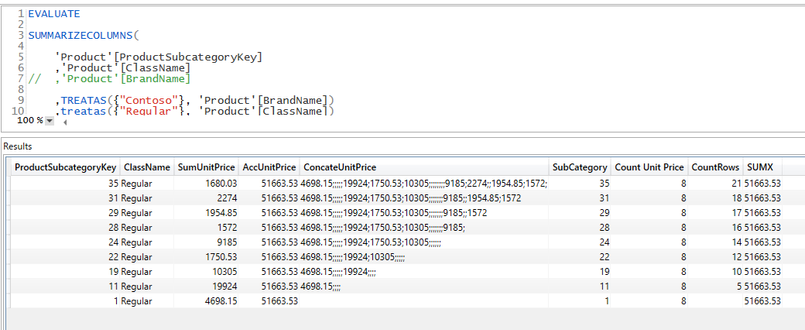
But if I commented out line #7 of the query,
All row’s AccUnitPrice return same values.
It seems that the return values are the sum of unit price of all but the one whose ProductSubCategoryKey is maximum (in this case #35 ) in the filter [BrandName]=”Contoso” && [ClassName]=”Regular”.
I cannot understand what is going on in this query. I would like to know in what kind of context AccUnitPrice of each row is evaluated and how it is calculated like this.
Any suggestions would be appreciated.
Thank you in advance.
Solved! Go to Solution.
- Mark as New
- Bookmark
- Subscribe
- Mute
- Subscribe to RSS Feed
- Permalink
- Report Inappropriate Content
Hi @Usagi_Nakamura ,
Answering to your last question:
Not that I am sure this is Auto-Exist anymore but in the example above, where you exchanged Product[UnitPrice] by Sales[UnitPrice] you were still having all the ingredients to trigger it according to this:
https://docs.microsoft.com/en-us/dax/all-function-dax
"An example where auto-exist and ALL() provide unexpected results is when filtering on two or more columns of the same table (like when using slicers), and there is a measure on that same table that uses ALL()."
In your last example ProductSubcategoryKey (ALL), ClassName and BrandName (SLICERS) are still from the same table. Now, while moving ClassName and BrandName to a different table could sort out the issue, we still want to learn why this is happening.
I leave it to the experts, but hoping this is of any help, I reproduced the scenario in PBI with the simplest table possible (just two rows, only one brand/class and no duplicates) to rule out possible causes:
The measure that breaks:
SUMX =
VAR CurrentKey = SELECTEDVALUE('Table'[Key])
RETURN
SUMX(
    FILTER(
        ALL('Table'[Key]);
        'Table'[Key]<CurrentKey
    );
    [Sum of UnitPrice]
)
A measure that works:
With Calculate =
VAR CurrentKey = SELECTEDVALUE('Table'[Key])
RETURN
CALCULATE(
    [Sum of UnitPrice];
    'Table'[Key]<CurrentKey
)
In PBI:
- A Table visualization with only one of the columns used to slice shown:
- Ok to slice by the one not present in the visualization:
- But as soon you slice by both of them the measure with SUMX breaks:
Regards,
Kudos are another nice way to acknowledge those who tried to help you.
J. Payeras
Mallorca, Spain
- Mark as New
- Bookmark
- Subscribe
- Mute
- Subscribe to RSS Feed
- Permalink
- Report Inappropriate Content
One thing I did for to think about this topic.
I tried several patterns of filter conditions and run the query.
Let me share the result as below.
With line #7 (= ,'Product'[BrandName] ) , all the result are natural and easy to understand.
But without line #7, I feel there are some regularities in calculations but I cannot express it in a sentence.
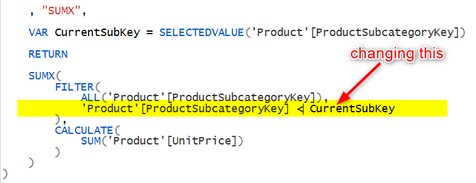
AA) changing to "'Product'[ProductSubcategoryKey] = CurrentSubKey"
<<Without line #7>>
<<With line #7>>
BB) changing to "'Product'[ProductSubcategoryKey] <> CurrentSubKey"
<<Without line #7>>
<<With line #7>>
CC) changing to "'Product'[ProductSubcategoryKey] = CurrentSubKey + 10"
<<Without line #7>>
<<With line #7>>
DD) changing to "'Product'[ProductSubcategoryKey] = 11"
<<Without line #7>>
<<With line #7>>
I am sorry but I am not sure that it is meaningful...
Regards,
- Mark as New
- Bookmark
- Subscribe
- Mute
- Subscribe to RSS Feed
- Permalink
- Report Inappropriate Content
@Usagi_Nakamura Yes, that is meaningul. That's basically similar to what I was trying to express in sentence in one of my earlier posts - the filter context of the subcategorykey seems to require that brandname row context, but only in SUMX and not in CONCATENATEX. That is why I added the CurrentSubcategoryKey column to my test query, but it didn't shed much light on the situation. I've put the call out for more input, will see if we get any other brains responding here, but thanks for keeping this thread going.
Please @mention me in your reply if you want a response.
Copying DAX from this post? Click here for a hack to quickly replace it with your own table names
Has this post solved your problem? Please Accept as Solution so that others can find it quickly and to let the community know your problem has been solved.
If you found this post helpful, please give Kudos C
I work as a Microsoft trainer and consultant, specialising in Power BI and Power Query.
www.excelwithallison.com
- Mark as New
- Bookmark
- Subscribe
- Mute
- Subscribe to RSS Feed
- Permalink
- Report Inappropriate Content
Hi @AllisonKennedy again,
Thank you very much for your comment.
For now, I would like to share to viewers the result from the revised senario into which you kindly add items in your previous post.
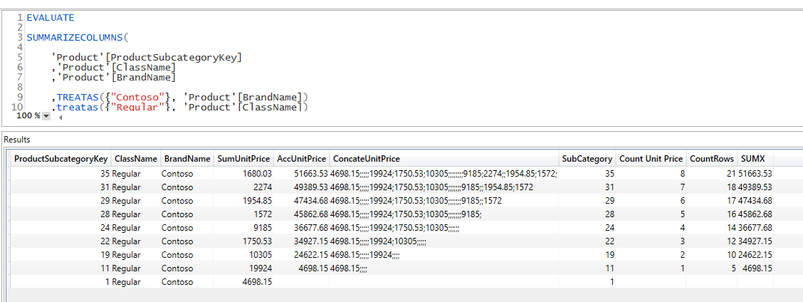
This shows certainly well the contrast between Countrows and Countx.
<<With line #7>>
<<Without line #7>>
Kind regards,
- Mark as New
- Bookmark
- Subscribe
- Mute
- Subscribe to RSS Feed
- Permalink
- Report Inappropriate Content
Hi @Payeras_BI
Muchas gracias for your help. That’s superbe!
But my query was at first summing ‘Sales’[SalesQuantity] and filtering ‘Product’[ClassName], ‘Product’[BrandName] and ‘Product’[ProductSubCategoryKey].
I doubted that the problem comes from relation matter ( for example, relation “both” etc. ) .So in order to eliminate impact of the relation, I made the model to single table one.
Anyway I will check my previous code.
Thank you again for your continuous help!
Regards,
- Mark as New
- Bookmark
- Subscribe
- Mute
- Subscribe to RSS Feed
- Permalink
- Report Inappropriate Content
Hi @Payeras_BI ,
I am sorry. I totally misunderstood what you said.
Even if we sum a column of another table instead of 'Product'[UnitPrice], we might not be able to get rid of this problem.
The problem might be coming from the fact that more than two filters are in one table.
The query for two table ( 1 Dimension ( Product ) + 1 Fact ( Sales ) but the same thing happens like this.
Regards,
- Mark as New
- Bookmark
- Subscribe
- Mute
- Subscribe to RSS Feed
- Permalink
- Report Inappropriate Content
Hi @Usagi_Nakamura ,
Answering to your last question:
Not that I am sure this is Auto-Exist anymore but in the example above, where you exchanged Product[UnitPrice] by Sales[UnitPrice] you were still having all the ingredients to trigger it according to this:
https://docs.microsoft.com/en-us/dax/all-function-dax
"An example where auto-exist and ALL() provide unexpected results is when filtering on two or more columns of the same table (like when using slicers), and there is a measure on that same table that uses ALL()."
In your last example ProductSubcategoryKey (ALL), ClassName and BrandName (SLICERS) are still from the same table. Now, while moving ClassName and BrandName to a different table could sort out the issue, we still want to learn why this is happening.
I leave it to the experts, but hoping this is of any help, I reproduced the scenario in PBI with the simplest table possible (just two rows, only one brand/class and no duplicates) to rule out possible causes:
The measure that breaks:
SUMX =
VAR CurrentKey = SELECTEDVALUE('Table'[Key])
RETURN
SUMX(
    FILTER(
        ALL('Table'[Key]);
        'Table'[Key]<CurrentKey
    );
    [Sum of UnitPrice]
)
A measure that works:
With Calculate =
VAR CurrentKey = SELECTEDVALUE('Table'[Key])
RETURN
CALCULATE(
    [Sum of UnitPrice];
    'Table'[Key]<CurrentKey
)
In PBI:
- A Table visualization with only one of the columns used to slice shown:
- Ok to slice by the one not present in the visualization:
- But as soon you slice by both of them the measure with SUMX breaks:
Regards,
Kudos are another nice way to acknowledge those who tried to help you.
J. Payeras
Mallorca, Spain
- Mark as New
- Bookmark
- Subscribe
- Mute
- Subscribe to RSS Feed
- Permalink
- Report Inappropriate Content
Hi @Payeras_BI
Thank you very much for your latest post which is really helpful to me and I am sorry for replying late.
I tried to map the cases in your post to corresponding my dax query and summarize the result.
<<In your case 1>>
In this case, One Grouping column (Class) + No filer => SUMX is OK
Corresponding dax query is
<<In your case 2>>
One grouping column ( Class ) + 1 Filter Column ( Brand ) => OK
Corresponding dax query is
<<In your case 3>>
One grouping column ( Class ) + 2 Filter Column ( Class, Brand ) => NG
Corresponding dax query is
I tried some other cases and summarizing the result as below.
Thank you Kind regards,
- Mark as New
- Bookmark
- Subscribe
- Mute
- Subscribe to RSS Feed
- Permalink
- Report Inappropriate Content
Hi @Payeras_BI ,
Thank you for giving me a hint which must be helpful.
I will try to understand the concept of dax-auto-exist and to apply it to this matter.
Kindest regards,
- Mark as New
- Bookmark
- Subscribe
- Mute
- Subscribe to RSS Feed
- Permalink
- Report Inappropriate Content
Hi again @Usagi_Nakamura ,
To be honest I also struggle to understand why the 51.663,53 for every row, let me know if you find out.
But, at least, if you follow the advice at the end of the article you get rid of the issue:
"In simpler data models with only one table and with a fancy data distribution of values, it might be possible to run into auto-exist problems. When this happens, the easiest solution is to avoid using a single table and to build a proper star schema instead."
Exact same query but now slicing on columns belonging to the dimension tables:
Regards,
Kudos are another nice way to acknowledge those who tried to help you.
J. Payeras
Mallorca, Spain
- Mark as New
- Bookmark
- Subscribe
- Mute
- Subscribe to RSS Feed
- Permalink
- Report Inappropriate Content
Hi @AllisonKennedy ,
Thank you very much for your kind suggestions!
Actually I knew that with your query, it work well.
In addition, your query, even if without line #63, can get same result.

In fact, my query was originally matrix visual and SumUnitPrice and AccUnitPrice were calculated measures and BrandName filter was coming from a Slicer visual. The query is made from such visuals, using power bi perfomance analyzer.
Moreover, for my query, I tried to change SUMX to CONCATENATEX and found that with or without line #7, same value is returned in every row. These values should be items to be calculated in SUMX version. But if I change again to Sumx, return values are different between with line #7 and without line #7.
<< With line #7>>
<<Without line #7>>
I tried to find out why it is possible but in vain for three months...
Thanks.
- Mark as New
- Bookmark
- Subscribe
- Mute
- Subscribe to RSS Feed
- Permalink
- Report Inappropriate Content
@Usagi_Nakamura I see your problem now, interesting that CONCATENATEX behaves differently than SUMX. To be honest, this query is multi-layered and not best practice optimised, so I would change it, but I am fascinated to learn from it. It's definitely helping me understand better some of the behaviour, and I have run into scenarios where SUMX doesn't behave as I expected and this might give insight to why.
Just for fun, here are some additional examples to add to your scenario. It seems COUNTROWS behaves as CONCATENATEX, while COUNTX behaves as SUMX. Try also commenting out the TREATAS that uses brand name and note that this also fixes things. The problem arises when you have a filter/relationship on a column that does not also exist in the table, and then try to use aggregate iterators:
Please @mention me in your reply if you want a response.
Copying DAX from this post? Click here for a hack to quickly replace it with your own table names
Has this post solved your problem? Please Accept as Solution so that others can find it quickly and to let the community know your problem has been solved.
If you found this post helpful, please give Kudos C
I work as a Microsoft trainer and consultant, specialising in Power BI and Power Query.
www.excelwithallison.com
- Mark as New
- Bookmark
- Subscribe
- Mute
- Subscribe to RSS Feed
- Permalink
- Report Inappropriate Content
Hi @Usagi_Nakamura ,
From your last explanation this behaviour seems to respond to what @AlbertoFerrari explains here https://www.sqlbi.com/articles/understanding-dax-auto-exist/
Regards,
Kudos are another nice way to acknowledge those who tried to help you.
J. Payeras
Mallorca, Spain
- Mark as New
- Bookmark
- Subscribe
- Mute
- Subscribe to RSS Feed
- Permalink
- Report Inappropriate Content
@Usagi_Nakamura You can try this instead:
Please @mention me in your reply if you want a response.
Copying DAX from this post? Click here for a hack to quickly replace it with your own table names
Has this post solved your problem? Please Accept as Solution so that others can find it quickly and to let the community know your problem has been solved.
If you found this post helpful, please give Kudos C
I work as a Microsoft trainer and consultant, specialising in Power BI and Power Query.
www.excelwithallison.com
- Mark as New
- Bookmark
- Subscribe
- Mute
- Subscribe to RSS Feed
- Permalink
- Report Inappropriate Content
@Usagi_Nakamura This is a very complex function -there's a lot going on. First, it's using CALCULATE to enable you to use SUM within a calculated column. The SUMMARIZECOLUMNS function creates a table with 2 calculated columns: "SumUnitPrice" and "AccUnitPrice". It creates these 2 columns within the context of the table it builds - when you comment out line 7, you remove the context of the ProductBrand, which impacts the context within which the SUMX is calculated. Since you have a CALCULATE(SUM() within that SUMX to calculate AccUnitPrice, this context change of removing ProductBrand matters.
Did I make any sense?
Please @mention me in your reply if you want a response.
Copying DAX from this post? Click here for a hack to quickly replace it with your own table names
Has this post solved your problem? Please Accept as Solution so that others can find it quickly and to let the community know your problem has been solved.
If you found this post helpful, please give Kudos C
I work as a Microsoft trainer and consultant, specialising in Power BI and Power Query.
www.excelwithallison.com
Helpful resources

FabCon Global Hackathon
Join the Fabric FabCon Global Hackathon—running virtually through Nov 3. Open to all skill levels. $10,000 in prizes!

Power BI Monthly Update - September 2025
Check out the September 2025 Power BI update to learn about new features.

