FabCon is coming to Atlanta
Join us at FabCon Atlanta from March 16 - 20, 2026, for the ultimate Fabric, Power BI, AI and SQL community-led event. Save $200 with code FABCOMM.
Register now!- Power BI forums
- Get Help with Power BI
- Desktop
- Service
- Report Server
- Power Query
- Mobile Apps
- Developer
- DAX Commands and Tips
- Custom Visuals Development Discussion
- Health and Life Sciences
- Power BI Spanish forums
- Translated Spanish Desktop
- Training and Consulting
- Instructor Led Training
- Dashboard in a Day for Women, by Women
- Galleries
- Data Stories Gallery
- Themes Gallery
- Contests Gallery
- QuickViz Gallery
- Quick Measures Gallery
- Visual Calculations Gallery
- Notebook Gallery
- Translytical Task Flow Gallery
- TMDL Gallery
- R Script Showcase
- Webinars and Video Gallery
- Ideas
- Custom Visuals Ideas (read-only)
- Issues
- Issues
- Events
- Upcoming Events
The Power BI Data Visualization World Championships is back! Get ahead of the game and start preparing now! Learn more
- Power BI forums
- Forums
- Get Help with Power BI
- Desktop
- Re: Dax function to add a column counting rows tha...
- Subscribe to RSS Feed
- Mark Topic as New
- Mark Topic as Read
- Float this Topic for Current User
- Bookmark
- Subscribe
- Printer Friendly Page
- Mark as New
- Bookmark
- Subscribe
- Mute
- Subscribe to RSS Feed
- Permalink
- Report Inappropriate Content
Dax function to add a column counting rows that are not null
Hello, i've been getting help from this forum for a long time, and this is my first time needing to ask a quesiton. It's been so helpful. However, i'm stumped on this. I have connected to a text file and filtered the query down to just the data I am needing. Now I'm trying to add a column to the query that will count the number of times a row has data in one of ten columns. I've pasted a table below with a sample of the data. I'm trying to grade the participants on frequency of participation. The values of each column are unique to how they connected to the event so they can all be a little different.
Does anyone have a suggestion on this?
| ID | Event 1 | Event 2 | Event 3 | Event 4 | Event 5 |
| 1 | dn321 | ||||
| 2 | as345 | as345 | |||
| 3 | se356 | ||||
| 4 | dn321 | dn321 | as345 | dn321 | dn321 |
| 5 | dn321 | dn322 | dn323 | ||
| 6 | se356 | se357 | se358 | se359 | |
| 7 | dn321 | dn322 | dn323 | as345 | se356 |
Solved! Go to Solution.
- Mark as New
- Bookmark
- Subscribe
- Mute
- Subscribe to RSS Feed
- Permalink
- Report Inappropriate Content
HI @Anonymous
So do you mean, for your row with an ID of 1 should return 1, while the row with an ID of 4 will return 5?
- Mark as New
- Bookmark
- Subscribe
- Mute
- Subscribe to RSS Feed
- Permalink
- Report Inappropriate Content
Hi osbrown,
Based on your description, you want to count nonblack data by each ID, right?
To achieve your requirement, please follow steps below:
- Click Query Editor->Column [ID]->Unpivot Other Columns.
- The table has been transformed into attribute-value pair, then delete Column [Attribute].
- To delete rows which contain blank, set filter on column [Value] using formula below.
= Table.SelectRows(#"Removed Columns", each [Value] <> "")
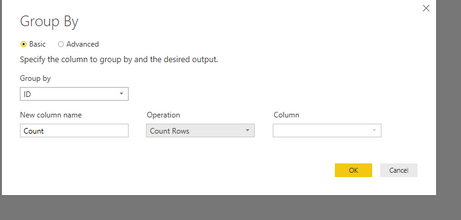
4.To count rows by ID, use group by function.
The result is like below and you can refer to PBIX file here:
https://www.dropbox.com/s/zajw7e5vj7ei1vo/For%20osbrown.pbix?dl=0

Best Regards,
Jimmy Tao
- Mark as New
- Bookmark
- Subscribe
- Mute
- Subscribe to RSS Feed
- Permalink
- Report Inappropriate Content
HI @Anonymous
So do you mean, for your row with an ID of 1 should return 1, while the row with an ID of 4 will return 5?
- Mark as New
- Bookmark
- Subscribe
- Mute
- Subscribe to RSS Feed
- Permalink
- Report Inappropriate Content
Hi @Anonymous
If so, this might be close to what you need. Just change the Table2 to your own table.
New Column =
    IF(LEN('Table2'[Event 1])>1,1) +
    IF(LEN('Table2'[Event 2])>1,1) +
    IF(LEN('Table2'[Event 3])>1,1) +
    IF(LEN('Table2'[Event 4])>1,1) +
    IF(LEN('Table2'[Event 5])>1,1)
- Mark as New
- Bookmark
- Subscribe
- Mute
- Subscribe to RSS Feed
- Permalink
- Report Inappropriate Content
Hi @Anonymous
You can do this using QUERY EDITOR as well.... since your ROW values are all SAME
SELECT THE 10 COLUMNS>>>Go to ADD COLUMN tab >>> STATISTICS>>>DISCTINCTCOUNT
Now add a custom column substracting 1 from Distinct Count
Regards
Zubair
Please try my custom visuals
Helpful resources

Power BI Dataviz World Championships
The Power BI Data Visualization World Championships is back! Get ahead of the game and start preparing now!

| User | Count |
|---|---|
| 66 | |
| 45 | |
| 43 | |
| 36 | |
| 23 |
| User | Count |
|---|---|
| 196 | |
| 125 | |
| 105 | |
| 77 | |
| 56 |


