Get certified for free when you join Fabric Data Days 2026 and dive into Fabric, Power BI, SQL, AI, and other essential data skills.
Join nowJuly 7 - July 17 | Round 2 of the Power BI Dataviz World Championships. Don't miss your chance! Learn more
Hi All,
I have two calculated columns and they are giving me surprising different results for a simple datediff function:
Days to Expire = DATEDIFF([Today],SQLViewName[Expiration Date],DAY)
Expiration Status = IF(SQLViewName[Expiration Date]=BLANK(),"NA",IF(SQLViewName[Days to Expire]<0,"Expired",IF(SQLViewName[Days to Expire]<=29,"Expiring in <30 days",IF(SQLViewName[Days to Expire]<=59,"Expiring in <60 days","Expiring in >=60 days"))))
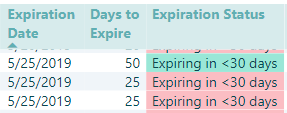
Row 1 is for some weird reason showing "Days to Expire" as 50 days to expire (when it should be 25 days like row 2 & 3) ... The "Expiration Status" column correctly categorizes but "Days to Expire" has it wrong!
Solved! Go to Solution.
So a colleague helped me realize that the value was being summarized! I had to select 'Don't Summarize' and it resolved the issue. Still trying to understand what field(s) was it picking to summarize on as each rows were different in some attributes.
Hi @cyclist007 ,
I was not able to replicate this problem on my side. Please clear the cache and refresh dataset for a try. And make sure your Power BI desktop is updated to the latest version.
If problem persists, would you share the sample .pbix file for check. Do mask sensitive data before sharing.
Regards,
Yuliana Gu
Yeah its not easily replicable as i also see this happening for only one-off cases. Have tried changing the connection to an Excel file (after exporting data to excel ... the formula works fine in Excel so data is not corrupted) but still shows incorrectly in just one of the calculated columns i Power BI Desktop (Aug 2018 Report server version - cannot upgrade as client is using same version).
How does one clear Cache?
So a colleague helped me realize that the value was being summarized! I had to select 'Don't Summarize' and it resolved the issue. Still trying to understand what field(s) was it picking to summarize on as each rows were different in some attributes.
Join us in Barcelona for FabCon and SQLCon, the Fabric, Power BI, SQL, and AI community event. Save €200 with code FABCMTY200.
Join Fabric Data Days 2026: 60 days of free live/on-demand sessions, challenges, study groups, and certification opportunities.
| User | Count |
|---|---|
| 24 | |
| 23 | |
| 17 | |
| 14 | |
| 13 |
| User | Count |
|---|---|
| 63 | |
| 41 | |
| 39 | |
| 39 | |
| 38 |