FabCon is coming to Atlanta
Join us at FabCon Atlanta from March 16 - 20, 2026, for the ultimate Fabric, Power BI, AI and SQL community-led event. Save $200 with code FABCOMM.
Register now!- Power BI forums
- Get Help with Power BI
- Desktop
- Service
- Report Server
- Power Query
- Mobile Apps
- Developer
- DAX Commands and Tips
- Custom Visuals Development Discussion
- Health and Life Sciences
- Power BI Spanish forums
- Translated Spanish Desktop
- Training and Consulting
- Instructor Led Training
- Dashboard in a Day for Women, by Women
- Galleries
- Data Stories Gallery
- Themes Gallery
- Contests Gallery
- QuickViz Gallery
- Quick Measures Gallery
- Visual Calculations Gallery
- Notebook Gallery
- Translytical Task Flow Gallery
- TMDL Gallery
- R Script Showcase
- Webinars and Video Gallery
- Ideas
- Custom Visuals Ideas (read-only)
- Issues
- Issues
- Events
- Upcoming Events
Get Fabric Certified for FREE during Fabric Data Days. Don't miss your chance! Request now
- Power BI forums
- Forums
- Get Help with Power BI
- Desktop
- Date slicer not working for calculated tables
- Subscribe to RSS Feed
- Mark Topic as New
- Mark Topic as Read
- Float this Topic for Current User
- Bookmark
- Subscribe
- Printer Friendly Page
- Mark as New
- Bookmark
- Subscribe
- Mute
- Subscribe to RSS Feed
- Permalink
- Report Inappropriate Content
Date slicer not working for calculated tables
Hi there! Relatively new to PowerBI and I hope someone here can help me out.
1. I have a fairly standard looking sales facts table called 'Working' that looks like this:
From this table, I've created 2 calculated tables.
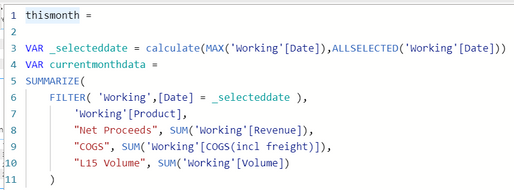
2. The first table is intended to include only sales in the latest month of the date range in a date slicer. Called 'thismonth'
the second table is similar to above, the only difference is that it filters the rows which correspond to the sales sold on minimum date. Called 'previousmonth' using
CALCULATE( MIN('Working'[Date]) , ALLSELECTED('Working'[Date]) )
3. The issue that I face is that the calculated tables do not return the desired result when I use a date slicer in the viz.
E.g. Slicing sales for the month of April with 'Working'[Date] in the date slicer has no effect on the results of the calculated table.
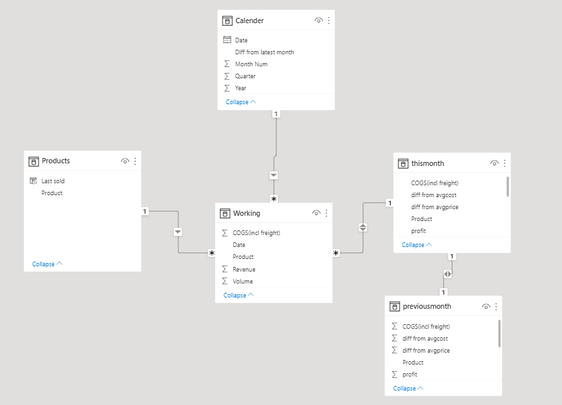
I've tried looking high and low for a solution, and I'm thinking there is an issue with my use of ALLSELECTED() function in a calculated table, but I'm not sure of an alternative to this. Any help would be greatly appreciated :'). Below is also the data model and relationships.
- Mark as New
- Bookmark
- Subscribe
- Mute
- Subscribe to RSS Feed
- Permalink
- Report Inappropriate Content
Hi, @seanlim
What is the purpose of creating time intelligence calculated tables?
I would suppose you want to play with time (this month, last month) in your report, but in that case you have to create time intelligence measures, instead of calculated tables?
Did I answer your question? Mark my post as a solution!
https://allure-analytics.com/
https://www.youtube.com/channel/UCndD_QZVNB_JWYLEmP6KrpA
https://www.linkedin.com/company/77757292/
Proud to be a Super User!
- Mark as New
- Bookmark
- Subscribe
- Mute
- Subscribe to RSS Feed
- Permalink
- Report Inappropriate Content
Hi @ALLUREAN,
I have a waterfall chart that is trying to compare breakdowns of revenue/cost/profits between 2 periods, depending on the selection of the user.
I used the Calender Table initially to dynamically show the revenue difference between the latest period and latest period -1 as the data was updated.
However, as I developed my Viz, I realized this was no longer a sufficient solution as it didn't allow the user to filter by the desired dates.
I also have a bunch of measures that depend on filtering the right sales data from 'Working' such as the product mix% of the current selection.
- Mark as New
- Bookmark
- Subscribe
- Mute
- Subscribe to RSS Feed
- Permalink
- Report Inappropriate Content
If understand correctly, you want to have a waterfall chart with always comparing this month vs last month and not showing slicer for months?
Maybe there are severals ways to do that.
1) Using default waterfall chart - you need to create a table with This Month, Last Month column and measure (switching) between previously created 2 measures: This Month, Last Month
2) Using custom visual - Simple Waterfall, where you can create 2 measures for This Month, Last Month and use them in values field to compare
Did I answer your question? Mark my post as a solution!
https://allure-analytics.com/
https://www.youtube.com/channel/UCndD_QZVNB_JWYLEmP6KrpA
https://www.linkedin.com/company/77757292/
Proud to be a Super User!
- Mark as New
- Bookmark
- Subscribe
- Mute
- Subscribe to RSS Feed
- Permalink
- Report Inappropriate Content
Forgive me if my question was unclear. But I am trying to compare 2 periods (latest period vs earliest period) in a given range specified by a date slicer.
- Mark as New
- Bookmark
- Subscribe
- Mute
- Subscribe to RSS Feed
- Permalink
- Report Inappropriate Content
Hi
Calculated tables will not react for the slicer selection. Calculated tables data are stored and the table values will not change for the date selection. You need to use measures with your logic which will pick up the dynamic selection and show the expected results.
Thanks
Hari
If I helped you, click on the Thumbs Up to give Kudos.
My Blog :: YouTube Channel :: My Linkedin
Helpful resources

Power BI Monthly Update - November 2025
Check out the November 2025 Power BI update to learn about new features.

Fabric Data Days
Advance your Data & AI career with 50 days of live learning, contests, hands-on challenges, study groups & certifications and more!


