Hi Friends,
I have a situation in my model where I have 2 date tables ( created date and closed date).
I have created a date table using dax but the issue is how to sync all 3 tables together?
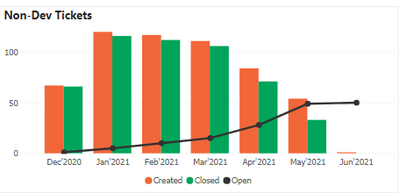
Currently i have a relationship of my dax date table with my created date in my model and the graph shows correct data for the created date whereas the data for closed date is not correct and when i make the relationship of my dax date table with the closed date the numbers for created date are wrong.
Any idea how to fix this? I want to show created and closed numbers together.
Please Note : I have two date tables in my model i.e Created and closed. I have created another date table using DAZ to setup the relationship.
https://www.dropbox.com/s/bzur2v335qpxsjr/Sample%20-%20Copy.pbix?dl=0
Above is the link for a sample pbix containing the data and the conditions. I want to show the non dev tickets together ( closed and opened)

Regards,
Himanshu


