Get certified for free when you join Fabric Data Days 2026 and dive into Fabric, Power BI, SQL, AI, and other essential data skills.
Join nowJuly 7 - July 17 | Round 2 of the Power BI Dataviz World Championships. Don't miss your chance! Learn more
Hi,
Apologies for my probably rather naive question, I am new to PowerBI but am already loving the desktop app!
Anyway, I am building a resource management tool using a Structured Excel Spreadsheet (for each person), into an Access Databse and using "Get Data" have linked the database in PowerBI.
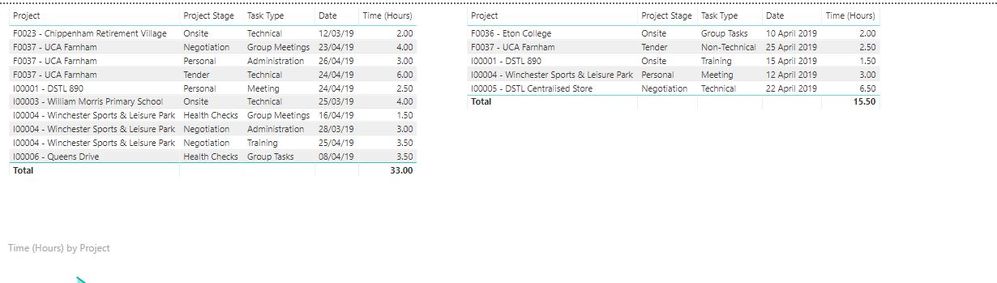
I am trying to understand the relationship manager but I'm having some difficulties. What would be the best way to report the data "as one" in the dashboard (see two seperate tables in image)? I can't physically merge the tables as I need to access the individual data in other reports but would like to report overall number of tasks and hours spent as one when I need to?
I would really appreciate the help 🙂
Ben
Solved! Go to Solution.
The easiest way would just be to link the tables by the project name. The only issue is if you have multiple lines with that same project name in each table. To get around, that you can create a "bridge" table. Just make a list of unique project names and then link both of the other tables to the "bridge".
This worked great, thank you!!
@benjamincoady : you can create a view if you have having database (MS Access ) and pull into powerbi and write your measures that is the simple way to achieve it .
Else in edit query window you will have the option of append queries can you trying merging your data into single and then perform the calcualtions else it will be difficult if you are having many files from all over persons . can you check these two options .
Really sorry, I'm struggling to understand your typed English....
Join us in Barcelona for FabCon and SQLCon, the Fabric, Power BI, SQL, and AI community event. Save €200 with code FABCMTY200.
Join Fabric Data Days 2026: 60 days of free live/on-demand sessions, challenges, study groups, and certification opportunities.
| User | Count |
|---|---|
| 24 | |
| 24 | |
| 17 | |
| 14 | |
| 13 |
| User | Count |
|---|---|
| 63 | |
| 41 | |
| 39 | |
| 39 | |
| 39 |