cancel
Showing results for 
Search instead for 
Did you mean: 

July 7 - July 17 | Round 2 of the Power BI Dataviz World Championships. Don't miss your chance! Learn more

Reply
bibhu250
Frequent Visitor

Data Modelling Help

Hi Folks,


I have 2 tables that contain transactional data, and want to show measures filtered using a slicer of dates(year - month). I implemented a Date Dim table and the values from this table populate the slicer. Based upon user selection, the selected dates are passed to the transaction table (SP_Delivery_Detail) and expected information is retrived correctly. The relation between Date & SP_Delivery_Detail is Delivery Date ---> Delivery_Date.


My second transactional table(L360_Survey) is related to the first (SP_Delivery_Detail) via the relation(active) : CSC_Code. 


The L360_Survey has NPS data and hence doesn't have entries for a contigous set of dates. When I created a relation(non active) between the Date & L360_Survey , and filtered using slicer, Selected slicer(time period) information is coming correctly, but any measures containing SAMEPERIODLASTYEAR is not coming correctly. Also, if this relation is created, then a circular relationship exist between all 3 tables.


To fix this, I created another Date dim table (Date 1), and used values from that table to populate slicer, then all information is coming correctly. My measure is Sum(Sales) and Sum(Sales) SAMEPERIODLASTYEAR , so if I select 2019 Dec, I get Sales of December of 2019 and 2018.


My question: In future, I need to bring more transactional tables which I am sure will be related to SP_Delivery_Detail. Will I then have to keep addding separate Date Dimension tables ? This doesnt seem scalable enough, wanted to know where I am going wrong. There has to be a better way than this.
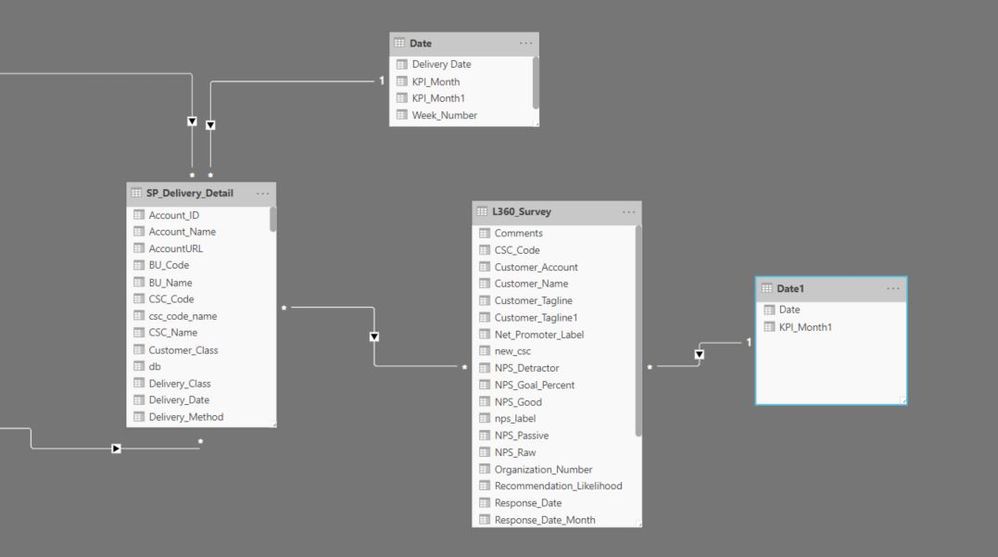
 

Power BI Model.JPG


2 ACCEPTED SOLUTIONS
amitchandak
Super User
Super User

Create only one date table that is marked as the date in date view.

Join it with L360_survey and SP_delivery. SP delivery join should be inactive and should be used only ren required formula's


Refer example of userelation : HR-Analytics-Active-Employee-Hire-and-Termination-trend


Appreciate your Kudos. In case, this is the solution you are looking for, mark it as the Solution. In case it does not help, please provide additional information and mark me with @
Thanks. My Recent Blog -
Winner-Topper-on-Map-How-to-Color-States-on-a-Map-with-Winners , HR-Analytics-Active-Employee-Hire-and-Termination-trend
Power-BI-Working-with-Non-Standard-Time-Periods And Comparing-Data-Across-Date-Ranges

Connect on Linkedin

Share with Power BI Enthusiasts: Full Power BI Video (20 Hours) YouTube
Microsoft Fabric Series 60+ Videos YouTube
Microsoft Fabric Hindi End to End YouTube

View solution in original post

@amitchandak 


I did try what you suggested but for some reason it didn't work. But, I was able to resolve this issue another way using a single date dim as you suggested with a bridge table.


I built a bridge table of unique key values between delivery and survey table. Also, 2 active relationships from the same date table fixed my issue.


Thanks much.

View solution in original post

2 REPLIES 2
amitchandak
Super User
Super User

Create only one date table that is marked as the date in date view.

Join it with L360_survey and SP_delivery. SP delivery join should be inactive and should be used only ren required formula's


Refer example of userelation : HR-Analytics-Active-Employee-Hire-and-Termination-trend


Appreciate your Kudos. In case, this is the solution you are looking for, mark it as the Solution. In case it does not help, please provide additional information and mark me with @
Thanks. My Recent Blog -
Winner-Topper-on-Map-How-to-Color-States-on-a-Map-with-Winners , HR-Analytics-Active-Employee-Hire-and-Termination-trend
Power-BI-Working-with-Non-Standard-Time-Periods And Comparing-Data-Across-Date-Ranges

Connect on Linkedin

Share with Power BI Enthusiasts: Full Power BI Video (20 Hours) YouTube
Microsoft Fabric Series 60+ Videos YouTube
Microsoft Fabric Hindi End to End YouTube

@amitchandak 


I did try what you suggested but for some reason it didn't work. But, I was able to resolve this issue another way using a single date dim as you suggested with a bridge table.


I built a bridge table of unique key values between delivery and survey table. Also, 2 active relationships from the same date table fixed my issue.


Thanks much.

Helpful resources

Announcements
FabCon and SQLCon Barcelona 2026

FabCon & SQLCon – Barcelona 2026

Join us in Barcelona for FabCon and SQLCon, the Fabric, Power BI, SQL, and AI community event. Save €200 with code FABCMTY200.

60 days of Data Days Carousel

Data Days 2026

Join Fabric Data Days 2026: 60 days of free live/on-demand sessions, challenges, study groups, and certification opportunities.

Power BI DataViz World Championships carousel

Power BI DataViz World Championships - June 2026

A new Power BI DataViz World Championship is coming this June! Don't miss out on submitting your entry.