This is best Fabric, Power BI, SQL and AI community event. How do we know? The last event sold out! Save €200 with code FABCMTY200.
Register nowA new Data Days event is coming soon! This time we’re going bigger than ever. Fabric, Power BI, SQL, AI and more. Don't miss out.
Hi there,
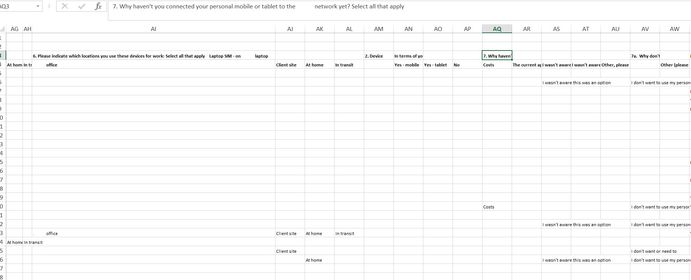
I have a data dump from a survey which requires extreme clean up to be useable in my Power Bi dashboard. I was going to clean it up on excel to start with.
As you can see the questions are listed and each option is a subheading which the user fills in across the row. (each row is an indiviuals answers i.e. column A lists the emails).
Would anyone know how I can rearrange this as there are 27 questions each with sub headings or sub questions.
Please see the attached picture for reference.
Regards,
Mike
This is exactly what Power Query does (get data). You can see some examples with my online training, but explaining how to do this based on a picture is not practicable. If you posted a sample file, someone may help you.
Thanks for the reply Matt. Would you know how I can upload the sample file to the post?
Cheers,
Mike
Just load it somewhere (eg DropBox) and post a link.
Check out the May 2026 Power BI update to learn about new features.
Sign up to receive a private message when registration opens and key events begin.
If you have recently started exploring Fabric, we'd love to hear how it's going. Your feedback can help with product improvements.
| User | Count |
|---|---|
| 31 | |
| 26 | |
| 25 | |
| 22 | |
| 13 |
| User | Count |
|---|---|
| 58 | |
| 50 | |
| 26 | |
| 20 | |
| 19 |