FabCon is coming to Atlanta
Join us at FabCon Atlanta from March 16 - 20, 2026, for the ultimate Fabric, Power BI, AI and SQL community-led event. Save $200 with code FABCOMM.
Register now!- Power BI forums
- Get Help with Power BI
- Desktop
- Service
- Report Server
- Power Query
- Mobile Apps
- Developer
- DAX Commands and Tips
- Custom Visuals Development Discussion
- Health and Life Sciences
- Power BI Spanish forums
- Translated Spanish Desktop
- Training and Consulting
- Instructor Led Training
- Dashboard in a Day for Women, by Women
- Galleries
- Data Stories Gallery
- Themes Gallery
- Contests Gallery
- Quick Measures Gallery
- Notebook Gallery
- Translytical Task Flow Gallery
- TMDL Gallery
- R Script Showcase
- Webinars and Video Gallery
- Ideas
- Custom Visuals Ideas (read-only)
- Issues
- Issues
- Events
- Upcoming Events
Join the Fabric FabCon Global Hackathon—running virtually through Nov 3. Open to all skill levels. $10,000 in prizes! Register now.
- Power BI forums
- Forums
- Get Help with Power BI
- Desktop
- Re: DAX Help - CrossFilter and LookUp
- Subscribe to RSS Feed
- Mark Topic as New
- Mark Topic as Read
- Float this Topic for Current User
- Bookmark
- Subscribe
- Printer Friendly Page
- Mark as New
- Bookmark
- Subscribe
- Mute
- Subscribe to RSS Feed
- Permalink
- Report Inappropriate Content
DAX Help - CrossFilter and LookUp
Community,
I am trying to return a difference using multiple tables. I need assistance with DAX for a measure that will return the correct result.
I have two tables...
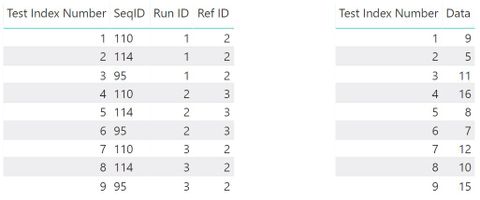
Table1 where;
Test Index Number = Populated as a sequential index for that days testing
SeqID = Set of requirements for a test
Run ID = Unique ID for a grouping of SeqID and a difference in the tested parts
Ref ID = A previous or upcoming Run ID to compare data between
Table2 where;
Test Index Number = Populated as a sequential index for that days testing (Matches table1)
Data = Data collect
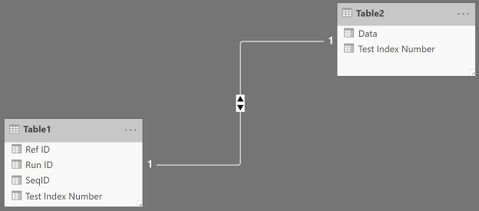
Tables and Relationships (tables connected by Test Index Number)
In the image below the green column would be what is looked up and the yellow column would be the difference between the two data. The yellow column is what I'm trying to replicate.
A test PBIX file can be found here.
- Mark as New
- Bookmark
- Subscribe
- Mute
- Subscribe to RSS Feed
- Permalink
- Report Inappropriate Content
As long as the data in the green column is connected via a relationship to Table1/Table2, then the following code should work in a calculated column:
Difference =
Table2[Data] - RELATED ( RefData[Ref Data] )
This uses the RELATED function to get the relevant value from the green column.
- Mark as New
- Bookmark
- Subscribe
- Mute
- Subscribe to RSS Feed
- Permalink
- Report Inappropriate Content
@Anonymous ,
I do not have the ref data as a column and am trying to create a measure for it. Any thoughts on how to replicate the ref data with a measure?
- Mark as New
- Bookmark
- Subscribe
- Mute
- Subscribe to RSS Feed
- Permalink
- Report Inappropriate Content
Is the ref data in another table?
Could you connect the tables by the Test Index Number?
- Mark as New
- Bookmark
- Subscribe
- Mute
- Subscribe to RSS Feed
- Permalink
- Report Inappropriate Content
I need to pull the ref data from the data column in the by looking at the Ref ID.
- Mark as New
- Bookmark
- Subscribe
- Mute
- Subscribe to RSS Feed
- Permalink
- Report Inappropriate Content
So is the ref data calculated? If so, how would you want it to be calculated?
In the example file you posted there's no field called ref data.
- Mark as New
- Bookmark
- Subscribe
- Mute
- Subscribe to RSS Feed
- Permalink
- Report Inappropriate Content
@Anonymous
The ref data would come from the data column.
The Ref ID is used to establish a comparison.
Maybe we could think of it as we would like to compare Test Index Number 1,2 and 3, vs. Test Index Number 7,8,9
The Run ID is a way to group the Test Index Numbers.


