Huge last-minute discounts for FabCon Vienna from September 15-18, 2025
Supplies are limited. Contact info@espc.tech right away to save your spot before the conference sells out.
Get your discount- Power BI forums
- Get Help with Power BI
- Desktop
- Service
- Report Server
- Power Query
- Mobile Apps
- Developer
- DAX Commands and Tips
- Custom Visuals Development Discussion
- Health and Life Sciences
- Power BI Spanish forums
- Translated Spanish Desktop
- Training and Consulting
- Instructor Led Training
- Dashboard in a Day for Women, by Women
- Galleries
- Data Stories Gallery
- Themes Gallery
- Contests Gallery
- Quick Measures Gallery
- Notebook Gallery
- Translytical Task Flow Gallery
- TMDL Gallery
- R Script Showcase
- Webinars and Video Gallery
- Ideas
- Custom Visuals Ideas (read-only)
- Issues
- Issues
- Events
- Upcoming Events
Score big with last-minute savings on the final tickets to FabCon Vienna. Secure your discount
- Power BI forums
- Forums
- Get Help with Power BI
- Desktop
- Re: Customer segmentation based on activity
- Subscribe to RSS Feed
- Mark Topic as New
- Mark Topic as Read
- Float this Topic for Current User
- Bookmark
- Subscribe
- Printer Friendly Page
- Mark as New
- Bookmark
- Subscribe
- Mute
- Subscribe to RSS Feed
- Permalink
- Report Inappropriate Content
Customer segmentation based on activity
Hi all,
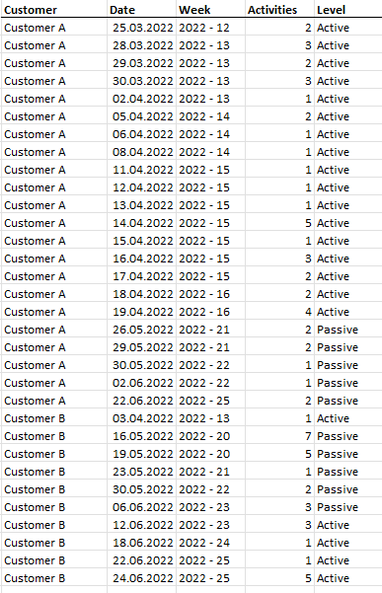
I'm trying to put customers into segments based on their activity in a 4 week cycle. So always looking back at the previous 4 weeks from a given date, and counting the number of activites not only in the 4 week periode but also the number of weeks with activity.
Here is some example data where the "Level" column is the one I wish to populate (and now done manully in Excel to show wanted outcome).
Hope that makes sense!
Thanks!
- Mark as New
- Bookmark
- Subscribe
- Mute
- Subscribe to RSS Feed
- Permalink
- Report Inappropriate Content
Hi @Anonymous ,
Why is the same customer with the same activity level different? Could you please provide more details with your desird output and pbix file without privacy information?
Best regards.
- Mark as New
- Bookmark
- Subscribe
- Mute
- Subscribe to RSS Feed
- Permalink
- Report Inappropriate Content
Please provide sanitized sample data that fully covers your issue. I cannot help you without usable sample data.
Please paste the data into a table in your post or use one of the file services like OneDrive or Google Drive. I cannot use screenshots of your source data.
Please show the expected outcome based on the sample data you provided. Screenshots of the expected outcome are ok.
https://community.powerbi.com/t5/Desktop/How-to-Get-Your-Question-Answered-Quickly/m-p/1447523


