Join us at FabCon Vienna from September 15-18, 2025
The ultimate Fabric, Power BI, SQL, and AI community-led learning event. Save €200 with code FABCOMM.
Get registered- Power BI forums
- Get Help with Power BI
- Desktop
- Service
- Report Server
- Power Query
- Mobile Apps
- Developer
- DAX Commands and Tips
- Custom Visuals Development Discussion
- Health and Life Sciences
- Power BI Spanish forums
- Translated Spanish Desktop
- Training and Consulting
- Instructor Led Training
- Dashboard in a Day for Women, by Women
- Galleries
- Data Stories Gallery
- Themes Gallery
- Contests Gallery
- Quick Measures Gallery
- Notebook Gallery
- Translytical Task Flow Gallery
- TMDL Gallery
- R Script Showcase
- Webinars and Video Gallery
- Ideas
- Custom Visuals Ideas (read-only)
- Issues
- Issues
- Events
- Upcoming Events
Enhance your career with this limited time 50% discount on Fabric and Power BI exams. Ends August 31st. Request your voucher.
- Power BI forums
- Forums
- Get Help with Power BI
- Desktop
- Cumulative sum by column no date
- Subscribe to RSS Feed
- Mark Topic as New
- Mark Topic as Read
- Float this Topic for Current User
- Bookmark
- Subscribe
- Printer Friendly Page
- Mark as New
- Bookmark
- Subscribe
- Mute
- Subscribe to RSS Feed
- Permalink
- Report Inappropriate Content
Cumulative sum by column no date
Hi, i have a little problem unsolved with a dax cumulative.
i have this table
| Category | Value |
| A | 1 |
| A | 1 |
| B | 1 |
| C | 1 |
| C | 1 |
| D | 1 |
I need to create a cumulative sum by category
So the result is this:
Category SumValues Cumulative
A 2 2
C 2 4
B 1 5
D 1 6
Total 6
How can i calculate the cumulative?
Thanks for help
Lima - Peru
- Mark as New
- Bookmark
- Subscribe
- Mute
- Subscribe to RSS Feed
- Permalink
- Report Inappropriate Content
Hi @Vvelarde,
In your scenario, why do you want to get the result based on the sorting A-> C-> B-> D. If we Group By based on Category in Query Editor, we can't sort by SumValues firstly then by Category. If we based on the normal category sorting, we can add a index column to calculate the running total easily.
Best Regards,
Qiuyun Yu
If this post helps, then please consider Accept it as the solution to help the other members find it more quickly.
- Mark as New
- Bookmark
- Subscribe
- Mute
- Subscribe to RSS Feed
- Permalink
- Report Inappropriate Content
I need to show order the category (A,B,C,D) by Sum of values. To Show Correctly a Cumulative Sum..Starting from Highest to Lowest.
My next step is show a measure in %.
A 2 (2/6)
C 2 (4/6)
B 1 (5/6)
D 1 (6/6)
Total 6
This is the reason of i don't show you in normal sorting
Lima - Peru
- Mark as New
- Bookmark
- Subscribe
- Mute
- Subscribe to RSS Feed
- Permalink
- Report Inappropriate Content
I had these measure that works when the sum of values is different by each category.
ValuesAcumulado =
VAR valor=Calculate(Sum(Table1[Values])
RETURN
SUMX(FILTER(All('Category');[SumaValues]>=valor);[SumaValues])
Where Category is a single table column with A,B,C,D and SumaValues = Calculate(Sum(Table1[Values]))
The problem is when have same sum values for 2 or more categories. The Sum takes all the categories with same values.
Lima - Peru
- Mark as New
- Bookmark
- Subscribe
- Mute
- Subscribe to RSS Feed
- Permalink
- Report Inappropriate Content
Hi @Vvelarde
Here is how I did.
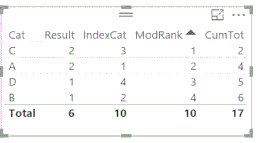
1. Created a Summarized table Table5 with columns Category as Cat and sum Values - Result from source table.
2. Created a running sequence number column using
IndexCat = CALCULATE(COUNTA(Table5[Cat]), FIlter(Table5,Table5[Cat]<=EARLIER(Table5[Cat])))
3. Created a Rank column
ModRank = RANKX(ALL(Table5), [Result]+[IndexCat]/100000,,0,Dense)
4. By adding IndexCat/100000 there will be no two values with same Rank even though the value of Result is the same.
5. Created a **bleep** total column
CumTot = CALCULATE(sum(Table5[Result]), FIlter(Table5,Table5[ModRank]<=EARLIER(Table5[ModRank])))
6. the output I got in a table format is
The only issue I could not resolve yet is to get the Cat in the ascending order of cat within same values of Reult.
May be you could throw some light on it.
Cheers
CheenuSing
Proud to be a Datanaut!


