Fabric Data Days starts November 4th!
Advance your Data & AI career with 50 days of live learning, dataviz contests, hands-on challenges, study groups & certifications and more!
Get registered- Power BI forums
- Get Help with Power BI
- Desktop
- Service
- Report Server
- Power Query
- Mobile Apps
- Developer
- DAX Commands and Tips
- Custom Visuals Development Discussion
- Health and Life Sciences
- Power BI Spanish forums
- Translated Spanish Desktop
- Training and Consulting
- Instructor Led Training
- Dashboard in a Day for Women, by Women
- Galleries
- Data Stories Gallery
- Themes Gallery
- Contests Gallery
- QuickViz Gallery
- Quick Measures Gallery
- Visual Calculations Gallery
- Notebook Gallery
- Translytical Task Flow Gallery
- TMDL Gallery
- R Script Showcase
- Webinars and Video Gallery
- Ideas
- Custom Visuals Ideas (read-only)
- Issues
- Issues
- Events
- Upcoming Events
Get Fabric Certified for FREE during Fabric Data Days. Don't miss your chance! Request now
- Power BI forums
- Forums
- Get Help with Power BI
- Desktop
- Cumulative display error of bar chart
- Subscribe to RSS Feed
- Mark Topic as New
- Mark Topic as Read
- Float this Topic for Current User
- Bookmark
- Subscribe
- Printer Friendly Page
- Mark as New
- Bookmark
- Subscribe
- Mute
- Subscribe to RSS Feed
- Permalink
- Report Inappropriate Content
Cumulative display error of bar chart
Hi all,
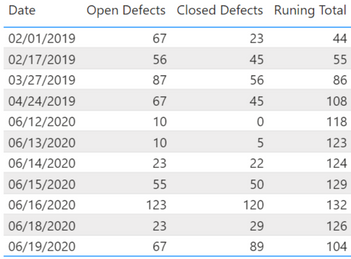
I have three measures called Opened defects and Closed defects and Running total. when i displayed in the table showing the .
In the above Runing total values are coming as expected. but i want displayed the same values in the bargaph. and when i applied any month filter it doesn't taking cumulative of previous month runing total in bar chart
in the above bar chart i applied the filter of march, it's taking the only march month runing total. its showing runing total 31 for the march in bargraph, but its needs to be shown 86 like shown in the table.
Please help me
Thanks!!
Nagaraju
Solved! Go to Solution.
- Mark as New
- Bookmark
- Subscribe
- Mute
- Subscribe to RSS Feed
- Permalink
- Report Inappropriate Content
Hi @Anonymous,
Please try to update the formula of your measure Running total similar with the below one and check if the return value is correct or not:
Running total =
CALCULATE (
    COUNT ( 'Open Cases'[Case Number] ),
    FILTER ( 'Open Cases', 'Open Cases'[Date] <= MAX ( 'Date'[Date] ) )
)
    - CALCULATE (
        COUNT ( 'Closed Cases'[Case Number] ),
        FILTER ( 'Closed Cases', 'Closed Cases'[Date] <= MAX ( 'Date'[Date] ) )
    )
If the above update is not working, please provide some sample data of your data model. Later we will help create measure suitable for your scenario. Thank you.
Best Regards
Rena
- Mark as New
- Bookmark
- Subscribe
- Mute
- Subscribe to RSS Feed
- Permalink
- Report Inappropriate Content
@Anonymous ,
are trying like
Cumm Sales = CALCULATE(SUM(Sales[Sales Amount]),filter(all(date),date[date] <=maxx(date,date[date])))
Try
Cumm Sales = CALCULATE(SUM(Sales[Sales Amount]),filter(allselected(date),date[date] <=maxx(date,date[date])))
or
Cumm Sales =
var _min =maxx(allselected(date),date[date])
return
CALCULATE(SUM(Sales[Sales Amount]),filter(date,date[date] <=maxx(date,date[date]) && date[date] >=_min))
- Mark as New
- Bookmark
- Subscribe
- Mute
- Subscribe to RSS Feed
- Permalink
- Report Inappropriate Content
Hi Amit,
Thank you for quick responce.
The values are shoiwng as expected. only pblm with display
lets take an example
Month Open defects Closed defects Runing total
March 1 0 1
April 4 4 1
we need to display the above information in bar chart with line. when i selcted the April as filter then the line value (Runing total) needs to start with 1 not 0
now its starting with 0 because for the april month opned is 4 Closed is 4 then runing is showing 0.
but in my requriment need to carry forward the runing total from previous month i.e 1
Thanks!!
Nagaraju
- Mark as New
- Bookmark
- Subscribe
- Mute
- Subscribe to RSS Feed
- Permalink
- Report Inappropriate Content
Hi @Anonymous,
Please try to update the formula of your measure Running total similar with the below one and check if the return value is correct or not:
Running total =
CALCULATE (
    COUNT ( 'Open Cases'[Case Number] ),
    FILTER ( 'Open Cases', 'Open Cases'[Date] <= MAX ( 'Date'[Date] ) )
)
    - CALCULATE (
        COUNT ( 'Closed Cases'[Case Number] ),
        FILTER ( 'Closed Cases', 'Closed Cases'[Date] <= MAX ( 'Date'[Date] ) )
    )
If the above update is not working, please provide some sample data of your data model. Later we will help create measure suitable for your scenario. Thank you.
Best Regards
Rena
Helpful resources

Power BI Monthly Update - November 2025
Check out the November 2025 Power BI update to learn about new features.

Fabric Data Days
Advance your Data & AI career with 50 days of live learning, contests, hands-on challenges, study groups & certifications and more!

| User | Count |
|---|---|
| 97 | |
| 76 | |
| 52 | |
| 51 | |
| 46 |


