Join us at the 2025 Microsoft Fabric Community Conference
Microsoft Fabric Community Conference 2025, March 31 - April 2, Las Vegas, Nevada. Use code FABINSIDER for a $400 discount.
Register now- Power BI forums
- Get Help with Power BI
- Desktop
- Service
- Report Server
- Power Query
- Mobile Apps
- Developer
- DAX Commands and Tips
- Custom Visuals Development Discussion
- Health and Life Sciences
- Power BI Spanish forums
- Translated Spanish Desktop
- Training and Consulting
- Instructor Led Training
- Dashboard in a Day for Women, by Women
- Galleries
- Webinars and Video Gallery
- Data Stories Gallery
- Themes Gallery
- Power BI DataViz World Championships Gallery
- Quick Measures Gallery
- R Script Showcase
- COVID-19 Data Stories Gallery
- Community Connections & How-To Videos
- 2021 MSBizAppsSummit Gallery
- 2020 MSBizAppsSummit Gallery
- 2019 MSBizAppsSummit Gallery
- Events
- Ideas
- Custom Visuals Ideas (read-only)
- Issues
- Issues
- Events
- Upcoming Events
The Power BI DataViz World Championships are on! With four chances to enter, you could win a spot in the LIVE Grand Finale in Las Vegas. Show off your skills.
- Power BI forums
- Forums
- Get Help with Power BI
- Desktop
- Cumulative Sum and Cumulative Sum Percentage
- Subscribe to RSS Feed
- Mark Topic as New
- Mark Topic as Read
- Float this Topic for Current User
- Bookmark
- Subscribe
- Printer Friendly Page
- Mark as New
- Bookmark
- Subscribe
- Mute
- Subscribe to RSS Feed
- Permalink
- Report Inappropriate Content
Cumulative Sum and Cumulative Sum Percentage
Hi,
I have a dataset which contains a case number, opended date, response target, response deviation in minutes. I added a custom column called First Response Calc for calculating the response target - response deviation in minutes.
I created a column named _First Response (hours) which calculates the date difference in hours because the Date/Time Opened and First Reponse Calc field:

What I would like to do is show a line value of cumulative open case percentages. For example 359 for 0-15 minutes would be 32% of the entire chart for the date range selected. Right now my line chart is only showing open case amounts for each time frame just as the bar chart is.
How do I calculate the cumulative amount and cumulative percentage?
Thanks,
Kevin
Solved! Go to Solution.
- Mark as New
- Bookmark
- Subscribe
- Mute
- Subscribe to RSS Feed
- Permalink
- Report Inappropriate Content
Hi @Anonymous ,
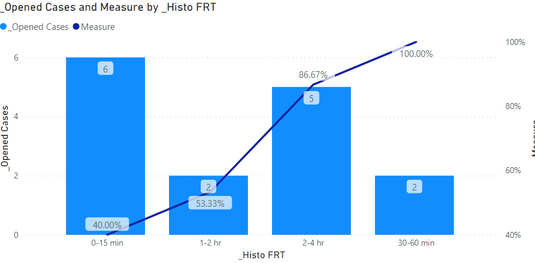
Modify the measure to the following form:
1. Create measure.
Measure =
var _1=COUNTX(FILTER(ALL('Sheet1'),'Sheet1'[_Histo FRT]<=MAX('Sheet1'[_Histo FRT])),[CaseNumber])
var _2=COUNTX(ALL('Sheet1'),'Sheet1'[_Opened Cases])
return
DIVIDE(_1,_2)
2. Result:
Best Regards,
Liu Yang
If this post helps, then please consider Accept it as the solution to help the other members find it more quickly
- Mark as New
- Bookmark
- Subscribe
- Mute
- Subscribe to RSS Feed
- Permalink
- Report Inappropriate Content
This works great! Thanks for the help.
- Mark as New
- Bookmark
- Subscribe
- Mute
- Subscribe to RSS Feed
- Permalink
- Report Inappropriate Content
Hi @Anonymous ,
Here are the steps you can follow:
1. Create measure.
Measure =
var _1=COUNTX(FILTER(ALL('Sheet1'),'Sheet1'[_Histo FRT]=MAX('Sheet1'[_Histo FRT])),[CaseNumber])
var _2=COUNTX(ALL('Sheet1'),'Sheet1'[_Opened Cases])
return
DIVIDE(_1,_2)
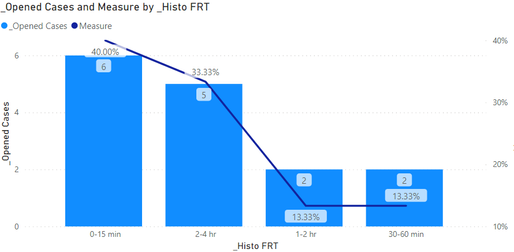
2. Place [Measure] in Line values.
3. Result:
Best Regards,
Liu Yang
If this post helps, then please consider Accept it as the solution to help the other members find it more quickly
- Mark as New
- Bookmark
- Subscribe
- Mute
- Subscribe to RSS Feed
- Permalink
- Report Inappropriate Content
Hi Liu,
The calculation you provided calculates the percentage of the total for each bar correctly (thank you).
I am looking to see a culmulative percentage though. If the first bar is 40%, then the second bar which is 33% should be 73.33% since it's a culumative percentage.
The bars and percentages should show:
Bar 1: 40%
Bar 2: 73.33%
Bar 3: 86.66
Bar 4: 100%
Is this something that can be done?
Thanks,
Kevin
- Mark as New
- Bookmark
- Subscribe
- Mute
- Subscribe to RSS Feed
- Permalink
- Report Inappropriate Content
Hello there @Anonymous ! Just as a suggestion, to simplify your coding steps and the readability the formulas you develop try using the SWITCH function instead of the multiple IFs() in the "_Histo FRT". It may not only help you create simpler measures but also evaluate possible errors.
Regarding your question, you can check similar these threads with solutions provided for similar questions to yours:
https://community.powerbi.com/t5/Desktop/cumulative-running-total-percentage/m-p/384190
https://community.powerbi.com/t5/Desktop/cumulative-percentages/m-p/571128
Hope this answer solves your problem!
If you need any additional help please @ me in your reply.
If my reply provided you with a solution, please consider marking it as a solution ✔️ or giving it a kudoe 👍
Thanks!
You can also check out my LinkedIn!
Best regards,
Gonçalo Geraldes
- Mark as New
- Bookmark
- Subscribe
- Mute
- Subscribe to RSS Feed
- Permalink
- Report Inappropriate Content
Hi Goncalo,
Thanks for your reply. I looked into those three forum questions before I sent the question out. They don't seem to work for what I want to do. I don't have a product with a sales dollar amount.
I have a number of cases within a time range. I am looking to calculate the cumulative percentage of cases as it refers to a particular time instance (0-15 minutes, 30-60 minutes, etc..)
Helpful resources

Join us at the Microsoft Fabric Community Conference
March 31 - April 2, 2025, in Las Vegas, Nevada. Use code MSCUST for a $150 discount!

Power BI Monthly Update - February 2025
Check out the February 2025 Power BI update to learn about new features.

| User | Count |
|---|---|
| 85 | |
| 79 | |
| 54 | |
| 39 | |
| 35 |
| User | Count |
|---|---|
| 102 | |
| 80 | |
| 48 | |
| 48 | |
| 48 |


