This is best Fabric, Power BI, SQL and AI community event. How do we know? The last event sold out! Save €200 with code FABCMTY200.
Register nowA new Data Days event is coming soon! This time we’re going bigger than ever. Fabric, Power BI, SQL, AI and more. Don't miss out.
Hi,
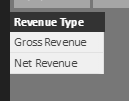
The table below show gross revenue and disbursement for a lot of projects (only one shown though). On my report canvas I want a slicer where I can toggle between Gross Revenue and Net Revenue, where Net Revenue should be calculated as Net Revenue = Gross Revenue + Disbursement.
I imagine I should create a New Measure but since Power BI and DAX is quite new to me I can't find out how.
Any ideas?
Table1
| Project | Type | Amount |
| 158894 | Gross Revenue | 2000 |
| 158894 | Gross Revenue | 1500 |
| 158894 | Gross Revenue | 1000 |
| 158894 | Disbursement | -700 |
| 158894 | Disbursement | -300 |
Solved! Go to Solution.
Hi @David_1970,
You need an extra table which contains only one column that will be added into slicer later.
Create measures as below:
Gross Revenue = CALCULATE ( SUM ( 'revenue table'[Amount] ), 'revenue table'[Type] = "Gross Revenue" ) Net Revenue = SUM ( 'revenue table'[Amount] )
Revenue =
IF (
LASTNONBLANK ( 'Slicer table'[Revenue Type], 1 ) = "Gross Revenue",
[Gross Revenue],
[Net Revenue]
)
Hi @David_1970,
You need an extra table which contains only one column that will be added into slicer later.
Create measures as below:
Gross Revenue = CALCULATE ( SUM ( 'revenue table'[Amount] ), 'revenue table'[Type] = "Gross Revenue" ) Net Revenue = SUM ( 'revenue table'[Amount] )
Revenue =
IF (
LASTNONBLANK ( 'Slicer table'[Revenue Type], 1 ) = "Gross Revenue",
[Gross Revenue],
[Net Revenue]
)
Hi and thanks!
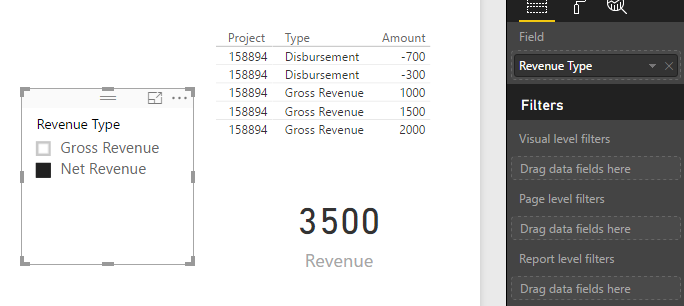
However, I also seem to get a (blank) tick box option in my slicer on the canvas in addition to the gross revenue and net revenue tick boxes. And revenue is only shown in the card visual when the (blank) tick box is selected, otherwise no revenue is shown.
I guess I have to do some trouble shooting.
Once again, many thank's.
@David_1970 to toggle look at the tecnique in this video from time 11:37
https://www.youtube.com/watch?v=Mpk9Js5jUeg
to create the measure
Net Revenue = sum(Gross Revenue) + sum(Disbursement)
Proud to be a Super User!
Check out the May 2026 Power BI update to learn about new features.
Sign up to receive a private message when registration opens and key events begin.
If you have recently started exploring Fabric, we'd love to hear how it's going. Your feedback can help with product improvements.
| User | Count |
|---|---|
| 32 | |
| 25 | |
| 23 | |
| 22 | |
| 13 |
| User | Count |
|---|---|
| 61 | |
| 47 | |
| 27 | |
| 24 | |
| 19 |