FabCon is coming to Atlanta
Join us at FabCon Atlanta from March 16 - 20, 2026, for the ultimate Fabric, Power BI, AI and SQL community-led event. Save $200 with code FABCOMM.
Register now!- Power BI forums
- Get Help with Power BI
- Desktop
- Service
- Report Server
- Power Query
- Mobile Apps
- Developer
- DAX Commands and Tips
- Custom Visuals Development Discussion
- Health and Life Sciences
- Power BI Spanish forums
- Translated Spanish Desktop
- Training and Consulting
- Instructor Led Training
- Dashboard in a Day for Women, by Women
- Galleries
- Data Stories Gallery
- Themes Gallery
- Contests Gallery
- QuickViz Gallery
- Quick Measures Gallery
- Visual Calculations Gallery
- Notebook Gallery
- Translytical Task Flow Gallery
- TMDL Gallery
- R Script Showcase
- Webinars and Video Gallery
- Ideas
- Custom Visuals Ideas (read-only)
- Issues
- Issues
- Events
- Upcoming Events
The Power BI Data Visualization World Championships is back! Get ahead of the game and start preparing now! Learn more
- Power BI forums
- Forums
- Get Help with Power BI
- Desktop
- Re: Creating a Histrogram that changes based on us...
- Subscribe to RSS Feed
- Mark Topic as New
- Mark Topic as Read
- Float this Topic for Current User
- Bookmark
- Subscribe
- Printer Friendly Page
- Mark as New
- Bookmark
- Subscribe
- Mute
- Subscribe to RSS Feed
- Permalink
- Report Inappropriate Content
Creating a Histrogram that changes based on user filters
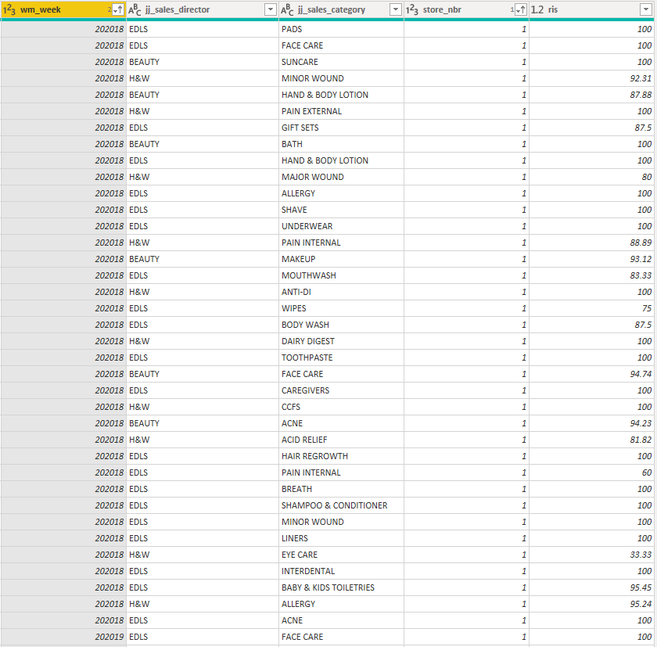
I have an interesting problem that I have spent more hours than i'd like to admit trying to figure out. I have the below data set example:
1) wm_week is the year/week of the data point.
2) jj_sales_director is the director category. There are 3 of these.
3) jj_sales_category is a category level. There are 20 or so different categories.
4) store_nbr is the store number.
5) ris is a % up to 100%.
I have created a histogram using a stacked column chart below:
I am trying to count the distinct stores by average RIS in the above buckets, which appears to work in the above. The problem is if I filter to the category or director I want it to the change the above visual to bucket the average RIS for that specific filter combination. RIght now it just doesnt change the counts when the user filters the dashboard.
I have made a few calculated columns below that are probably the issue but I have been unable to find a way to do it:
Averages the instock and filters by just store: (Calculated Column)
Creates the buckets: (Measure)
Below is how I have placed the data in the column chart.
Any help would be appreciated.
- Mark as New
- Bookmark
- Subscribe
- Mute
- Subscribe to RSS Feed
- Permalink
- Report Inappropriate Content
Since calculated columns do not work through filters in real time as you suggest, I tried a different approach but still no luck. This is incredibly frustrating because I am sure there is a simple answer.
I created a Bucket Table to break it down into the groups I want on the Histogram:
I then created a measure to put the data into the bins:

- Mark as New
- Bookmark
- Subscribe
- Mute
- Subscribe to RSS Feed
- Permalink
- Report Inappropriate Content
Hi, @jbaker15
I'd like to suggest you modify the calculated column as measure. A measure will reflect the selection of the slicer in time, and the column is refreshed only after loading and clicking the Refresh button, and it cannot be timely interacted with other visual interact.
Please try to use the following measures.
Avg inStock =
VAR store1 =
    SELECTEDVALUE ( 'Instock L30 Days'[store_nbr] )
RETURN
    CALCULATE (
        AVERAGE ( 'Instock L30 Days'[ris] ),
        FILTER (
            ALLSELECTED ( 'Instock L30 Days' ),
            'Instock L30 Days'[store_nbr] = store1
        )
    )

Range1 = var temp= [Avg inStock] return
if(temp<=10,"0-10%",if(AND(temp>10,temp<=20),"10-20%",if(AND(temp>20,temp<=30),"20-30%",if(AND(temp>30,temp<=40),"30-40%",if(AND(temp>40,temp<=50),"40-50%",if(AND(temp>50,temp<=60),"50-60%",if(AND(temp>60,temp<=70),"60-70%",if(AND(temp>70,temp<=80),"70-80%",if(AND(temp>80,temp<=90),"80-90%",if(AND(temp>90,temp<=92),"90-92%",if(AND(temp>92,temp<=94),"92-94%",if(AND(temp>94,temp<=96),"94-96%",if(AND(temp>96,temp<=98),"96-98%","98-100%")))))))))))))
Best Regards
Allan
If this post helps, then please consider Accept it as the solution to help the other members find it more quickly.
- Mark as New
- Bookmark
- Subscribe
- Mute
- Subscribe to RSS Feed
- Permalink
- Report Inappropriate Content
Hello, I appreciate the repsonse. When I change Avg inStock to a measure I can no longer put it as a variable in Range1. It also wont allow me to put a measure in as a shared axis on a stacked column chart.
Maybe this isnt possible. Any other thoughts?
Helpful resources

Power BI Dataviz World Championships
The Power BI Data Visualization World Championships is back! Get ahead of the game and start preparing now!

| User | Count |
|---|---|
| 38 | |
| 37 | |
| 34 | |
| 31 | |
| 27 |
| User | Count |
|---|---|
| 136 | |
| 99 | |
| 73 | |
| 66 | |
| 65 |


