Join us in Barcelona for FabCon and SQLCon, September 28 - October 1, 2026.
This is best Fabric, Power BI, SQL and AI community event. How do we know? The last event sold out! Save €200 with code FABCMTY200.
Register now- Power BI forums
- Get Help with Power BI
- Desktop
- Service
- Report Server
- Power Query
- Mobile Apps
- Developer
- DAX Commands and Tips
- Custom Visuals Development Discussion
- Health and Life Sciences
- Power BI Spanish forums
- Translated Spanish Desktop
- Training and Consulting
- Instructor Led Training
- Dashboard in a Day for Women, by Women
- Galleries
- Data Stories Gallery
- Themes Gallery
- Contests Gallery
- QuickViz Gallery
- Quick Measures Gallery
- Visual Calculations Gallery
- Notebook Gallery
- Translytical Task Flow Gallery
- TMDL Gallery
- R Script Showcase
- Webinars and Video Gallery
- Ideas
- Custom Visuals Ideas (read-only)
- Issues
- Issues
- Events
- Upcoming Events
A new Data Days event is coming soon! This time we’re going bigger than ever. Fabric, Power BI, SQL, AI and more. Don't miss out.
- Power BI forums
- Forums
- Get Help with Power BI
- Desktop
- Create dynamically calculated table based on measu...
- Subscribe to RSS Feed
- Mark Topic as New
- Mark Topic as Read
- Float this Topic for Current User
- Bookmark
- Subscribe
- Printer Friendly Page

- Mark as New
- Bookmark
- Subscribe
- Mute
- Subscribe to RSS Feed
- Permalink
- Report Inappropriate Content
Create dynamically calculated table based on measures to determine if FY Plan or Budget is defined
Hi
For a project portfolio, I have Plan and Budget data broken down by FY-Month and CostType. Now I need to determine whether a specific project has any Plan or Bugdet amounts in the current or previous FY.
The relevant tables are
- Projects : PID - Name
- Financial Facts: PID - Source - Type - Date - Amount
- Calendar: Date - FY - Month - FYoffset
The project table has ~ 1000 records, the Financial facts has ~ 100.000 records, the calendar table has ~3650 records (= 10 years).
Tables Project and Financials are linked by PID, Financials and Calendar are linked by date (=last day of the month).
In Calendar table the FYoffset =0 for the current FY; and =-1 for previous FY based on todays date (our FY starts Oct, 1st).
Also, I already have two measures defined to determine the budgeted and planned amounts.
- Budget = CALCULATE(SUM('Financial Facts'[Amount]), 'Financial Facts'[Source]="Budget")
- Planned = CALCULATE(SUM('Financial Facts'[Amount]),'Financial Facts'[Source]="Planned")
Now, I need to create a dynamically calculated table to show per PID, whether is has any Plan/Budget in Curr/Prev FY.
Those shall be used as filters for both visuals (slicers, list, matrix, charts) and report or page filters. Wondering, if I rather need to go back to Power Query (M-code) and add those 4 attributes as calculated columns in a new query (PID - inPrevPlan - inPrevBudget - inCurrPlan - inCurrBudget).
Or is there a better way to do this in DAX, evtl. by adding more measures?
Would performance likely be better in DAX, or M?
I'm pretty familiar with M-code, but also wanted to get better at DAX too (just a DAX beginner right now).
I already tried to play with the Solving Attendance with the Disconnected Table Trick from Greg Deckler.
And I looked at the solution provided by v-sihou-msft for the Filter by a measure problem.
Both seemed very promising to me, but I cannot get it to work for my case.
Appreciate any help to move me into the right direction.
Michael
Sample source tables:
| Projects | |
| PID | Name |
| 100 | Project A |
| 110 | Project B |
| 120 | Project C |
| Financial Facts | ||||
| PID | Source | Type | Date | Amount |
| 100 | Planned | Labor | 30-Sep | 120 |
| 100 | Planned | Travel | 31-Oct | 200 |
| 100 | Budget | Labor | 30-Sep | 120 |
| 100 | Budget | Travel | 31-Oct | 200 |
| 110 | Planned | Labor | 30-Sep | 300 |
| 110 | Planned | Travel | 31-Oct | 200 |
| 110 | Budget | Labor | 30-Sep | 300 |
| 120 | Planned | Labor | 31-Oct | 400 |
| 120 | Budget | Labor | 31-Oct | 400 |
| Calendar | ||||
| Date | FY | Month | FYoffset | |
| 30-Sep | FY18 | Sep | -1 | = Prev FY |
| 31-Oct | FY19 | Oct | 0 | = Curr FY |
Desired result:
| Dynamically Calculated Table | ||||
| PID | Prev FY Plan | Prev FY Budget | Cur FY Plan | Cur FY Budget |
| 100 | TRUE | TRUE | TRUE | TRUE |
| 110 | TRUE | TRUE | TRUE | FALSE |
| 120 | FALSE | FALSE | TRUE | TRUE |
Solved! Go to Solution.


- Mark as New
- Bookmark
- Subscribe
- Mute
- Subscribe to RSS Feed
- Permalink
- Report Inappropriate Content
Hi @Anonymous
You may add 4 measures first. Then you may get the table use SUMMARIZECOLUMNS Function. Here is the sample file for your reference.
Budget18 = CALCULATE(SUM('Financial Facts'[Amount]),FILTER('Financial Facts', 'Financial Facts'[Source]="Budget"&&RELATED('Calendar'[FY])="FY18"))Budget19 = CALCULATE(SUM('Financial Facts'[Amount]),FILTER('Financial Facts', 'Financial Facts'[Source]="Budget"&&RELATED('Calendar'[FY])="FY19"))Planned18 = CALCULATE(SUM('Financial Facts'[Amount]),FILTER('Financial Facts', 'Financial Facts'[Source]="Planned"&&RELATED('Calendar'[FY])="FY18"))Planned19 = CALCULATE(SUM('Financial Facts'[Amount]),FILTER('Financial Facts', 'Financial Facts'[Source]="Planned"&&RELATED('Calendar'[FY])="FY19"))Table =
SUMMARIZECOLUMNS (
'Financial Facts'[PID],
"Planned in FY18", IF ( ISBLANK ( [Planned18] ), "False", "True" ),
"Planned in FY19", IF ( ISBLANK ( [Planned19] ), "False", "True" ),
"Budget in FY18", IF ( ISBLANK ( [Budget18] ), "False", "True" ),
"Budget in FY19", IF ( ISBLANK ( [Budget19] ), "False", "True" )
)Regards,
Cherie
If this post helps, then please consider Accept it as the solution to help the other members find it more quickly.
- Mark as New
- Bookmark
- Subscribe
- Mute
- Subscribe to RSS Feed
- Permalink
- Report Inappropriate Content
Hi @Anonymous
You may create two measures and drag them to Matrix visual as below. Here is the sample file for your reference.
Has Budget = IF(ISBLANK([Budget]),"False","True")
Has Plan = IF(ISBLANK([Planned]),"False","True")
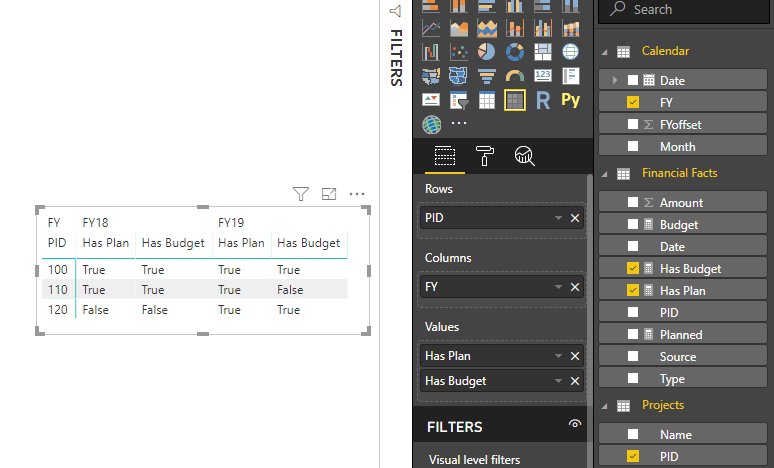
Regards,
Cherie
If this post helps, then please consider Accept it as the solution to help the other members find it more quickly.
- Mark as New
- Bookmark
- Subscribe
- Mute
- Subscribe to RSS Feed
- Permalink
- Report Inappropriate Content
Hi Cherie,
Thanks for the quick feedback and the PBI model. Although the two measures calculate well, I can only use them as 'values' in the resulting matrix visual. But what I really need is to use the data in the matrix as 'filters'. So the users can select them in a slicer or set them as default page/report filter.
I already tried various hard coded variations of the result matrix too, but only your layout seems to really do the trick.
I also managed to create the M code to generate the result matrix as a query table in Power Query. So I can at least use the data for slicers and page/report filter as needed. I just had to ensure that when building the relation between the Project table and the Matrix Result set, the Cross Filtering is enabled in both directions.

This was the M code that generates the matrix as a new query table (called 'Dynamic FY relation 3' table in screenshot above).
let
    Source = #"Financial Facts",
    #"Merged Queries" = Table.NestedJoin(Source,{"Date"},Calendar,{"Date"},"Calendar",JoinKind.LeftOuter),
    #"Expanded Calendar" = Table.ExpandTableColumn(#"Merged Queries", "Calendar", {"FY"}, {"Calendar.FY"}),
    #"Grouped Rows" = Table.Group(#"Expanded Calendar", {"PID", "Source", "Calendar.FY"}, {{"FY Total", each List.Sum([Amount]), type number}}),
    #"Merged Columns" = Table.CombineColumns(#"Grouped Rows",{"Source", "Calendar.FY"},Combiner.CombineTextByDelimiter(" in ", QuoteStyle.None),"FY Relation"),
    #"Pivoted Column" = Table.Pivot(#"Merged Columns", List.Distinct(#"Merged Columns"[#"FY Relation"]), "FY Relation", "FY Total", List.NonNullCount),
    #"Changed Type" = Table.TransformColumnTypes(#"Pivoted Column",{{"Planned in FY18", type text}, {"Budget in FY18", type text}, {"Planned in FY19", type text}, {"Budget in FY19", type text}}),
    #"Replaced Value (yes)" = Table.ReplaceValue(#"Changed Type","1","yes",Replacer.ReplaceText,{"Planned in FY18", "Budget in FY18", "Planned in FY19", "Budget in FY19"}),
    #"Replaced Value (no)" = Table.ReplaceValue(#"Replaced Value (yes)","0","no",Replacer.ReplaceText,{"Planned in FY18", "Budget in FY18", "Planned in FY19", "Budget in FY19"})
in
    #"Replaced Value (no)"
I uploaded a revised PBI model to Dropbox in case someone may find this useful. I also includes the test with soem static result sets that did not support my requirements. (Revised PBI model)
What I still don't know, is if the same table can also be added directly in DAX, and if this would be more performant in DAX. But at least I can go on with what I have so far.
Regards,
Michael
- Mark as New
- Bookmark
- Subscribe
- Mute
- Subscribe to RSS Feed
- Permalink
- Report Inappropriate Content
Hi @Anonymous
You may add 4 measures first. Then you may get the table use SUMMARIZECOLUMNS Function. Here is the sample file for your reference.
Budget18 = CALCULATE(SUM('Financial Facts'[Amount]),FILTER('Financial Facts', 'Financial Facts'[Source]="Budget"&&RELATED('Calendar'[FY])="FY18"))Budget19 = CALCULATE(SUM('Financial Facts'[Amount]),FILTER('Financial Facts', 'Financial Facts'[Source]="Budget"&&RELATED('Calendar'[FY])="FY19"))Planned18 = CALCULATE(SUM('Financial Facts'[Amount]),FILTER('Financial Facts', 'Financial Facts'[Source]="Planned"&&RELATED('Calendar'[FY])="FY18"))Planned19 = CALCULATE(SUM('Financial Facts'[Amount]),FILTER('Financial Facts', 'Financial Facts'[Source]="Planned"&&RELATED('Calendar'[FY])="FY19"))Table =
SUMMARIZECOLUMNS (
'Financial Facts'[PID],
"Planned in FY18", IF ( ISBLANK ( [Planned18] ), "False", "True" ),
"Planned in FY19", IF ( ISBLANK ( [Planned19] ), "False", "True" ),
"Budget in FY18", IF ( ISBLANK ( [Budget18] ), "False", "True" ),
"Budget in FY19", IF ( ISBLANK ( [Budget19] ), "False", "True" )
)Regards,
Cherie
If this post helps, then please consider Accept it as the solution to help the other members find it more quickly.
Helpful resources

Power BI Monthly Update - May 2026
Check out the May 2026 Power BI update to learn about new features.

Data Days 2026 coming soon!
Sign up to receive a private message when registration opens and key events begin.

New to Fabric Survey
If you have recently started exploring Fabric, we'd love to hear how it's going. Your feedback can help with product improvements.

Power BI DataViz World Championships - June 2026
A new Power BI DataViz World Championship is coming this June! Don't miss out on submitting your entry.

| User | Count |
|---|---|
| 27 | |
| 25 | |
| 25 | |
| 21 | |
| 14 |


| User | Count |
|---|---|
| 50 | |
| 45 | |
| 22 | |
| 18 | |
| 18 |


