Join us at FabCon Vienna from September 15-18, 2025
The ultimate Fabric, Power BI, SQL, and AI community-led learning event. Save €200 with code FABCOMM.
Get registered- Power BI forums
- Get Help with Power BI
- Desktop
- Service
- Report Server
- Power Query
- Mobile Apps
- Developer
- DAX Commands and Tips
- Custom Visuals Development Discussion
- Health and Life Sciences
- Power BI Spanish forums
- Translated Spanish Desktop
- Training and Consulting
- Instructor Led Training
- Dashboard in a Day for Women, by Women
- Galleries
- Data Stories Gallery
- Themes Gallery
- Contests Gallery
- Quick Measures Gallery
- Notebook Gallery
- Translytical Task Flow Gallery
- TMDL Gallery
- R Script Showcase
- Webinars and Video Gallery
- Ideas
- Custom Visuals Ideas (read-only)
- Issues
- Issues
- Events
- Upcoming Events
Compete to become Power BI Data Viz World Champion! First round ends August 18th. Get started.
- Power BI forums
- Forums
- Get Help with Power BI
- Desktop
- Create a measure to calculate average by row
- Subscribe to RSS Feed
- Mark Topic as New
- Mark Topic as Read
- Float this Topic for Current User
- Bookmark
- Subscribe
- Printer Friendly Page
- Mark as New
- Bookmark
- Subscribe
- Mute
- Subscribe to RSS Feed
- Permalink
- Report Inappropriate Content
Create a measure to calculate average by row
Hello everyone,
I am working with the price of many products and I need to create a measure that shows the average price of them. I have the following table
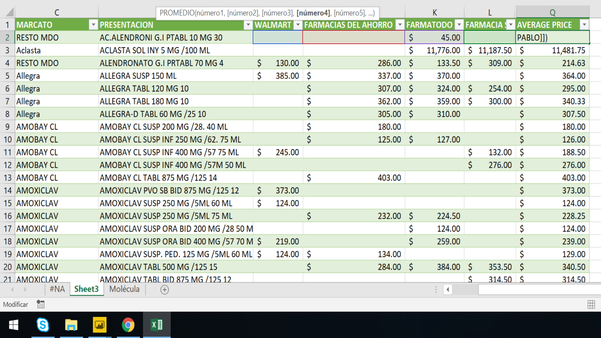
"PRESENTACION" are the name of the products, and "WALMART", "FARMACIAS DEL AHORRO", "FARMATODO", "FARMACIAS SAN PABLO" are the name of the columns that contains the prices of each product.
I need to create a measure that calculates the average of price of the products.
I tried with the average function but it calculates it by row.
What I need to do is like the last screen capture of excel but with a measure in power BI.
Hope you can help me.
Thank You.
Solved! Go to Solution.
- Mark as New
- Bookmark
- Subscribe
- Mute
- Subscribe to RSS Feed
- Permalink
- Report Inappropriate Content
@Anonymous -
Ideally, you would Unpivot the multiple separate columns into an Amount column and have another column which indicates the store.
As it stands now, you would need to refer to each column within a measure, like this:
Your Measure =
var Total = SUM(YourTable[Walmart]) + SUM(YourTable[Store2]) + SUM ......
var ValueCount = IF(ISBLANK(SUM(YourTable[Walmart])),0,1) + IF(ISBLANK(SUM(YourTable[Store2])),0,1) + ......
return DIVIDE(Total,ValueCount)
Hope this helps,
Nathan


