Get certified for free when you join Fabric Data Days 2026 and dive into Fabric, Power BI, SQL, AI, and other essential data skills.
Join nowJuly 7 - July 17 | Round 2 of the Power BI Dataviz World Championships. Don't miss your chance! Learn more
I am looking to create a view that shows stakeholders and the programs that they are dependent on. I attempted to do this with a tree view but it only allows me to show the stakeholders under each program. Is there a view that would allow me to show that ex. Jack is dependent on Program 1 and Program 2 without simply listing the stakeholders under each project?
| Project 1 | Project 2 | Project 3 | Project 4 | |
| John | X | |||
| Jack | X | X | ||
| Steve | X | X | X | |
| Bill | X |
Solved! Go to Solution.
You must normalize your data. Select the Name column in Power Query, and then un pivot other columns on the Transform ribbon. It will return the following table. THen can set slicers or filters by project or person.
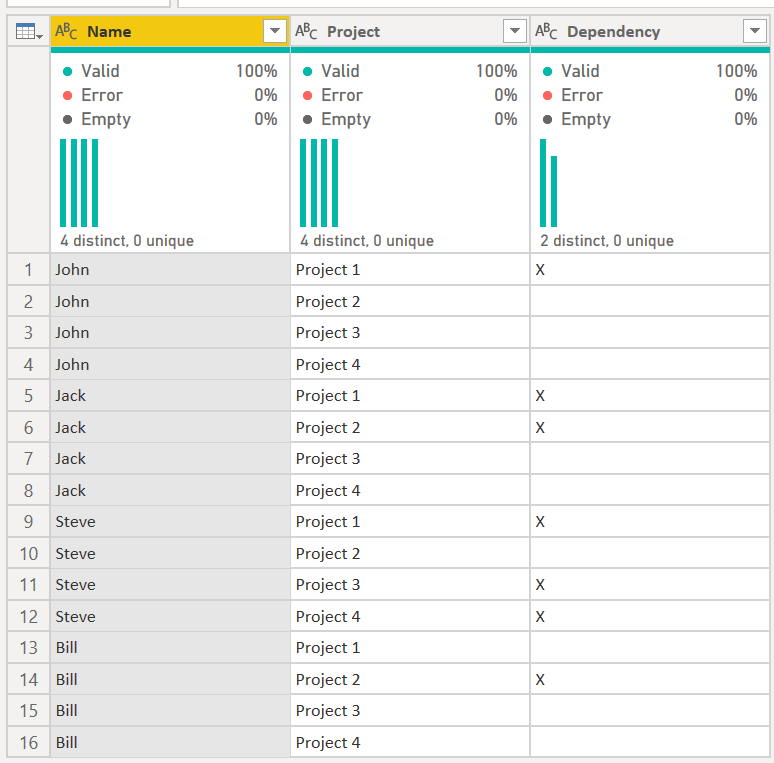
See the M code below to see what I did.
1) In Power Query, select New Source, and then select Blank Query
2) On the Home ribbon, select the "Advanced Editor"
3) Remove everything you see, then paste the M code I gave you into that box.
4) Tap Done
let
Source = Table.FromRows(Json.Document(Binary.Decompress(Binary.FromText("i45W8srPyFNQ0lGKAGIFOI7VAcokJmdDJSJQJIJLUstSkUQhKkAyTpk5OUiCUC2xAA==", BinaryEncoding.Base64), Compression.Deflate)), let _t = ((type text) meta [Serialized.Text = true]) in type table [Name = _t, #"Project 1" = _t, #"Project 2" = _t, #"Project 3" = _t, #"Project 4" = _t]),
#"Changed Type" = Table.TransformColumnTypes(Source,{{"Name", type text}, {"Project 1", type text}, {"Project 2", type text}, {"Project 3", type text}, {"Project 4", type text}}),
#"Unpivoted Other Columns" = Table.UnpivotOtherColumns(#"Changed Type", {"Name"}, "Project", "Dependency")
in
#"Unpivoted Other Columns"
DAX is for Analysis. Power Query is for Data Modeling
Proud to be a Super User!
MCSA: BI ReportingYou must normalize your data. Select the Name column in Power Query, and then un pivot other columns on the Transform ribbon. It will return the following table. THen can set slicers or filters by project or person.
See the M code below to see what I did.
1) In Power Query, select New Source, and then select Blank Query
2) On the Home ribbon, select the "Advanced Editor"
3) Remove everything you see, then paste the M code I gave you into that box.
4) Tap Done
let
Source = Table.FromRows(Json.Document(Binary.Decompress(Binary.FromText("i45W8srPyFNQ0lGKAGIFOI7VAcokJmdDJSJQJIJLUstSkUQhKkAyTpk5OUiCUC2xAA==", BinaryEncoding.Base64), Compression.Deflate)), let _t = ((type text) meta [Serialized.Text = true]) in type table [Name = _t, #"Project 1" = _t, #"Project 2" = _t, #"Project 3" = _t, #"Project 4" = _t]),
#"Changed Type" = Table.TransformColumnTypes(Source,{{"Name", type text}, {"Project 1", type text}, {"Project 2", type text}, {"Project 3", type text}, {"Project 4", type text}}),
#"Unpivoted Other Columns" = Table.UnpivotOtherColumns(#"Changed Type", {"Name"}, "Project", "Dependency")
in
#"Unpivoted Other Columns"
DAX is for Analysis. Power Query is for Data Modeling
Proud to be a Super User!
MCSA: BI ReportingJoin us in Barcelona for FabCon and SQLCon, the Fabric, Power BI, SQL, and AI community event. Save €200 with code FABCMTY200.
Join Fabric Data Days 2026: 60 days of free live/on-demand sessions, challenges, study groups, and certification opportunities.
| User | Count |
|---|---|
| 24 | |
| 24 | |
| 17 | |
| 14 | |
| 13 |
| User | Count |
|---|---|
| 66 | |
| 41 | |
| 39 | |
| 39 | |
| 38 |